Help
Learn how to use Diamond Core
1. GETTING STARTED
Diamond Core is a sports league management platform. It lets you manage tournaments, teams, players, game schedules, live scoring, and statistics — all in one place.
Signing In
To use Diamond Core, you need an account. Go to the login page and enter your username and password. Once signed in, you will see the home page with all available sections.
Your Role
What you can do depends on your role:
- Viewer — You can browse games, rosters, and scores (read only).
- Scorer — You can do everything a Viewer can, plus score live games and manage lineups.
- Administrator — Full access, including creating tournaments, teams, players, and games in the Setup area.
Your Organization
Diamond Core supports multiple organizations. If you belong to more than one, you can switch between them using the dropdown in the top-right corner of the screen, next to your name. Tournaments, games, and scoring data are scoped to your current organization. Players and clubs are shared globally across all organizations.
2. FINDING YOUR WAY AROUND
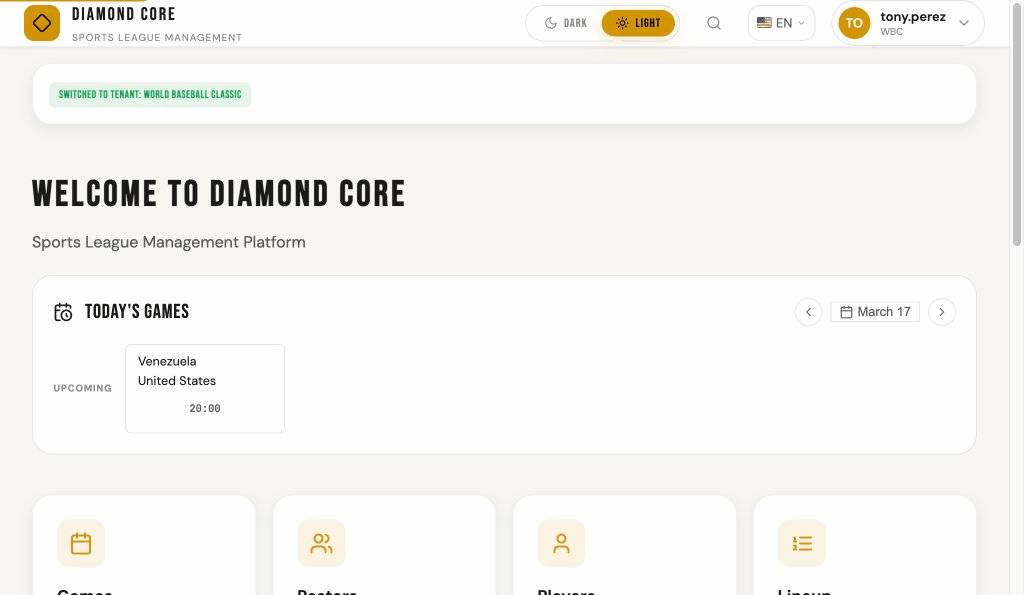
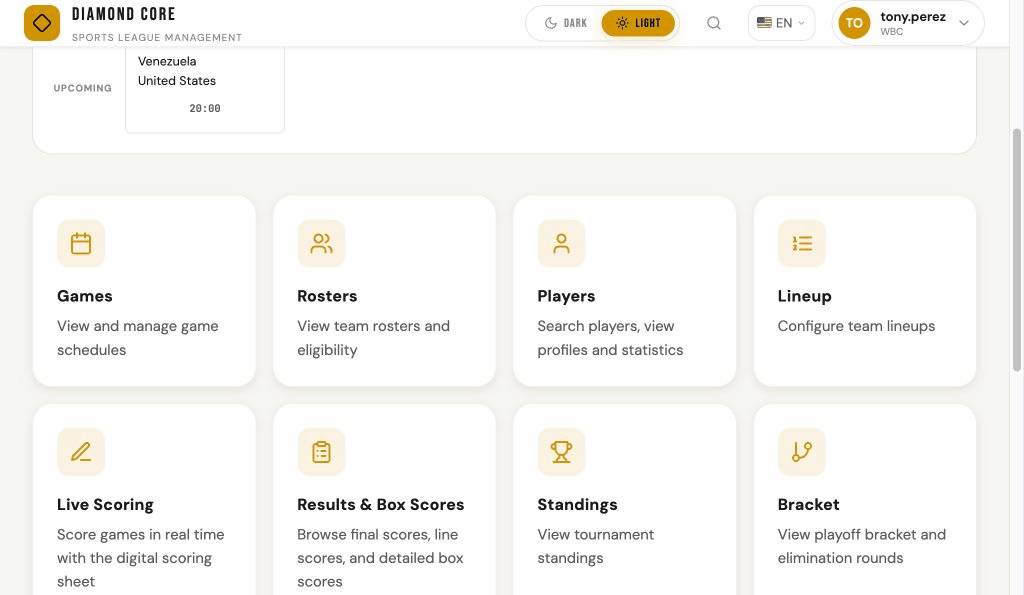
Home Page
The home page shows cards for every section of the platform: Games, Rosters, Live Scoring, and more. Click any card to go to that section.
Sidebar
On desktop, a sidebar appears on the left with links to all sections. You can collapse the sidebar by clicking the toggle button in the header bar (next to the logo) or the arrow at the top of the sidebar. The sidebar fully hides to give more screen space. Click the toggle again to bring it back. Your preference is remembered between visits.
Mobile
On phones and tablets, tap the menu icon (three horizontal lines) in the top-left corner to open the sidebar. Tap any link or tap outside the sidebar to close it.
Top Bar
The top bar always shows the Diamond Core logo (click it to go home), the dark/light theme toggle, and your user menu. If you are signed in, click your name to see options like signing out or switching organizations.
Global Search
Press Ctrl+K (or Cmd+K on Mac) or click the search icon in the top bar to open the global search. Type at least two characters to search across players, clubs, games, and tournaments. Use the arrow keys to navigate results and Enter to open the selected item. Press Escape to close the search. Guest users can also use global search — results include data from all organizations and link to read-only public pages.
Today's Games
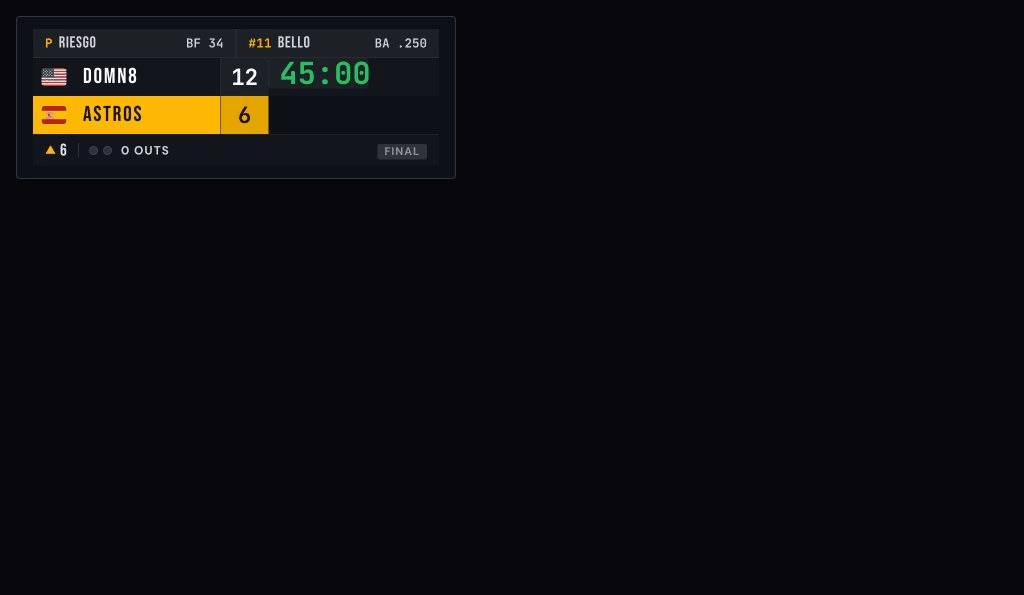
The home page shows a Today's Games widget with three sections: Live games display real-time scores, the current inning (with a pulsing green indicator), small pulsing red out dots showing the number of outs in the current half-inning (1 or 2), and a countdown timer when a game timer is running. The timer counts down in real time and changes color from green (more than 5 minutes) to yellow (1–5 minutes) to red (under 1 minute, with a pulsing animation). Upcoming games show scheduled start times, and Final games show the completed score with the winner highlighted. The widget refreshes automatically every 30 seconds. Click any game card to open its detail page. Final games also display a small document icon — click it to see a quick Game Recap popup with the result summary without leaving the home page.
You can browse games on other dates using the date navigation controls next to the title. Click the left arrow to go to the previous day, the right arrow for the next day, or click the date label to open a calendar picker and jump to any date. The title changes to show the selected date (e.g. "Games — Jun 15, 2025"). When viewing today, auto-refresh and live timers remain active; on other dates they are paused since there are no live updates needed.
When no games are scheduled for today, the widget shows the date of the next upcoming game. A slim Live Now banner also appears at the top of every page when games are in progress, linking back to the home page.
Tables on Small Screens
On phones and tablets, tables with many columns automatically hide less-important columns to fit the screen. You can scroll the table horizontally to see all the data. A hint appears below the table when more columns are available off-screen. When printing, all columns are always shown.
Back to Top
On pages with a lot of content, a circular arrow button appears in the bottom-right corner once you scroll down. Click it to smoothly scroll back to the top of the page.
3. MESSAGES
Diamond Core includes an internal messaging system. Users within the same organization can send messages to each other directly within the platform — no external email required.
Accessing Messages
Click the mail icon (envelope) in the top navigation bar to open the inbox panel. The inbox slides open and shows your recent messages.
Unread Badge
A red badge on the mail icon shows the number of unread messages. The badge disappears when all messages have been read.
Inbox Panel
The inbox panel shows your recent messages. Each entry displays the sender name, subject, a short preview of the message body, and the timestamp. Unread messages appear bold and highlighted so you can quickly spot new mail.
Composing Messages
To send a new message:
- Click the Compose button in the inbox panel header.
- Search and select one or more recipients. Each recipient shows a colored status dot: green means online, red means offline.
- Enter a subject (required) and your message body.
- Optionally attach files: drag & drop files onto the compose area, click to browse your device, or paste images directly from your clipboard. You can attach up to 5 files, each with a maximum size of 5 MB.
- Click Send to deliver the message.
Reading Messages
Click a message in the inbox to view the full message. The detail view shows the sender, all recipients (each with an online/offline status dot), the complete message body, and any attachments.
Downloading Attachments
If a message includes attachments, they appear as clickable links in the message view. Click an attachment link to download the file to your device.
Deleting Messages
Click the Delete button in the message view to remove a message from your inbox. Deleting a message only affects your inbox — other recipients still see their own copy.
Message Retention
Messages are automatically deleted after 15 days, including all attachments. There is no way to recover messages after they are removed.
4. GAMES
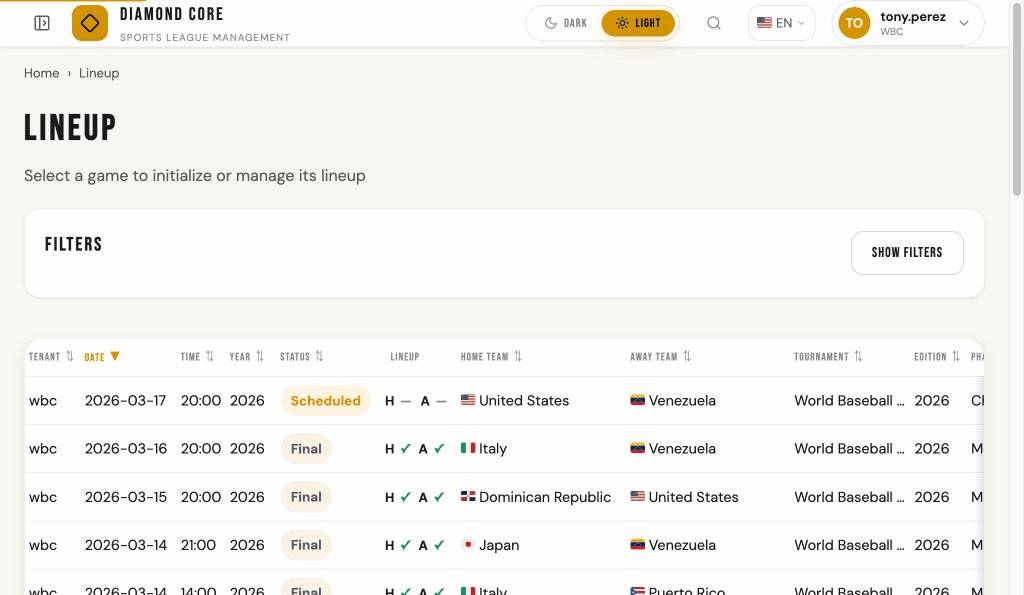
Games List
The Games page shows all scheduled and completed games. Each row shows the date, tournament, edition, phase (e.g. Round Robin, Medal Round), teams (with country flags), and game status.
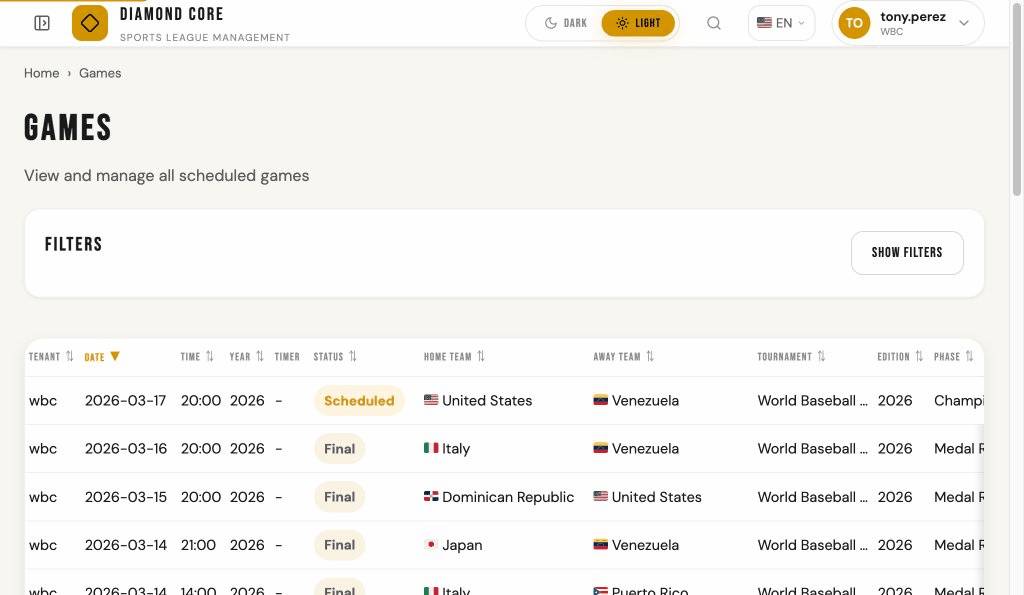
Filtering
Use the filter panel at the top to narrow down the list. Click Show Filters to expand the panel. When filters are active and the panel is collapsed, a badge shows the number of active filters. You can filter by:
- Season (year)
- Tournament
- Edition
- Gender
- Field / Venue
- Club name
- Phase (e.g. Round Robin, Medal Round)
- Game status (Scheduled, Live, Final, Canceled, Postponed)
When filters are applied, pill tags appear below the filter panel showing each active filter (e.g. "Season: 2025"). Click Clear All Filters to reset all filters at once.
Sorting
Click any column header to sort by that column. Click again to reverse the order. The active sort column is highlighted in amber with a bold arrow (▲ or ▼). Hold Shift and click another column to sort by multiple columns at the same time (for example, sort by date first, then by game number).
Game Status
- Scheduled — The game has not started yet.
- Live — The game is in progress.
- Final — The game is over and the score is official.
- Canceled — The game will not be played.
- Postponed — The game has been delayed to another date.
If a game has been in Live status for more than 24 hours, a red Stale badge appears next to its status. This usually means the game was never properly finalized or canceled after it ended.
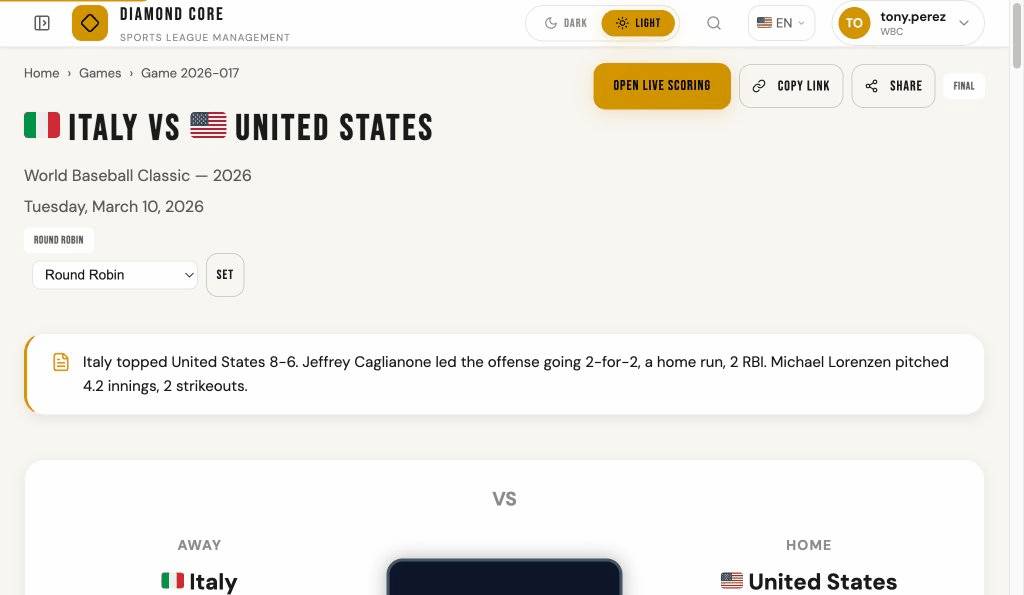
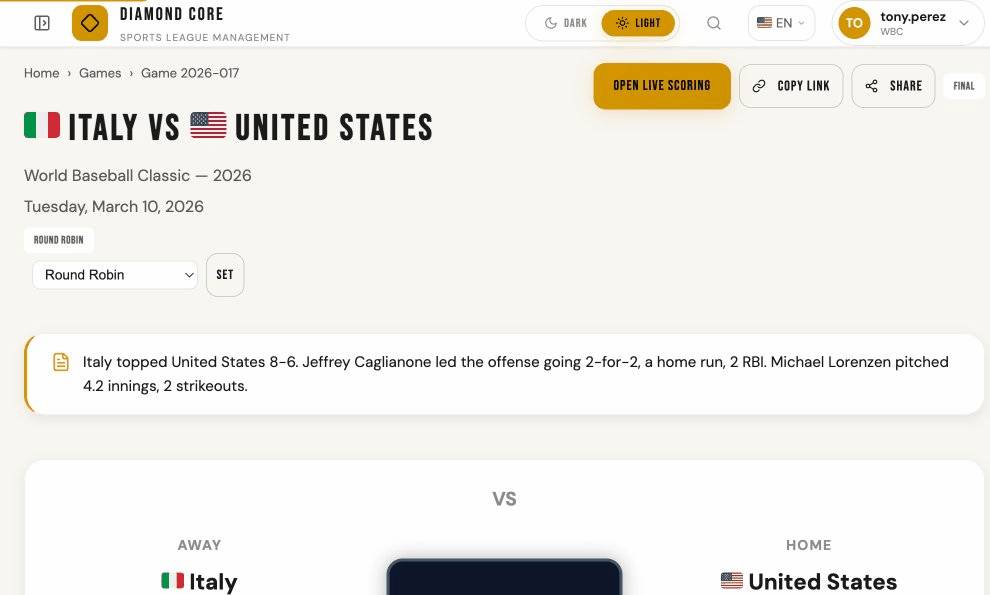
Game Detail
Click any game to see its detail page. This shows the full scoreboard with the score by inning, team lineups, and links to the box score and scoring sheet.
Player Detail: Click any player name in the lineup tables to open a detail modal showing the player's profile, tournament stats (batting and pitching), game log, biography, and sanctions.
If the venue has GPS coordinates, a map is displayed with the venue location. Click Get Directions below the map or inside the map marker popup to open Google Maps with turn-by-turn directions from your current location.
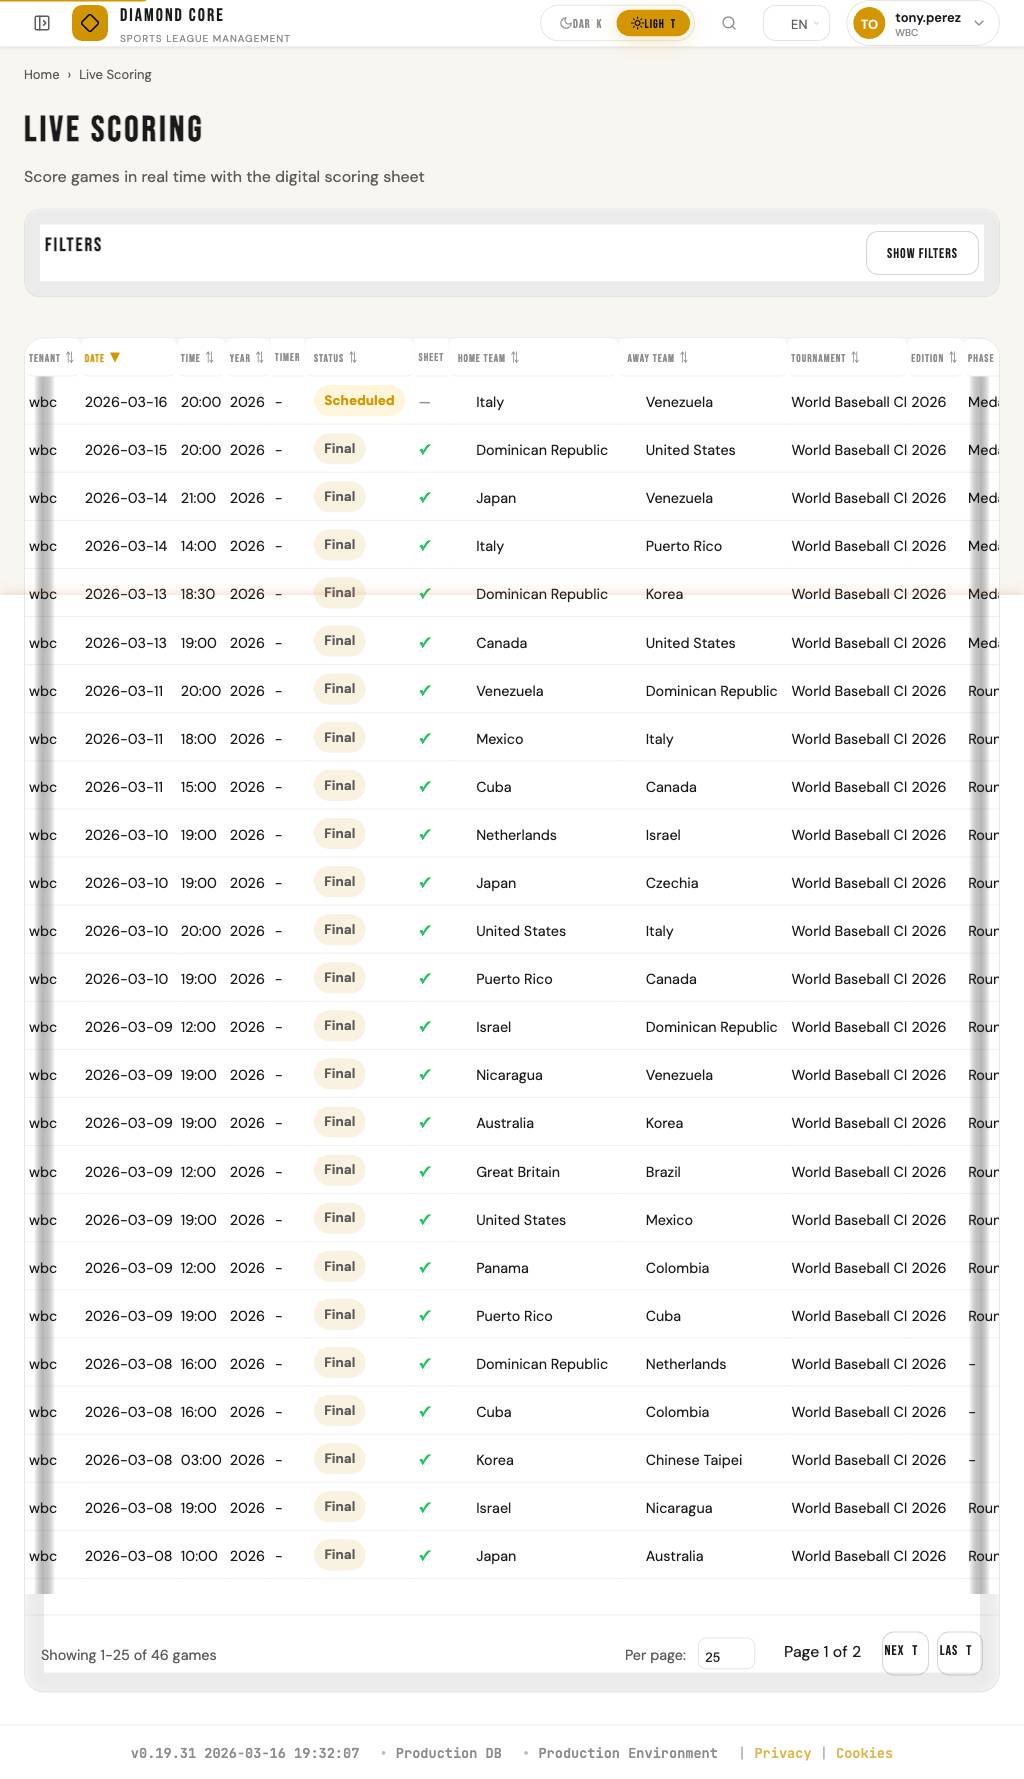
5. LIVE SCORING
The scoring sheet is the heart of Diamond Core. It is a digital version of the official paper scoring sheet used by scorers at the field.
Live Scoring Game Selection
Click Live Scoring in the sidebar to open the Live Scoring game selection page. This page lists all games with the same filters, sorting, and pagination as the Games page, including live timers for in-progress games. A Sheet column shows a green check mark if a scoring sheet already exists, or a dash if not. Clicking a game row takes you directly to the scoring sheet (if one exists) or to the game detail page (where you can create one).
Getting to the Scoring Sheet
From the game detail page, click the scoring sheet link. If a scoring sheet does not exist yet, an administrator or scorer can create one. You must have the Scorer role to record plays.
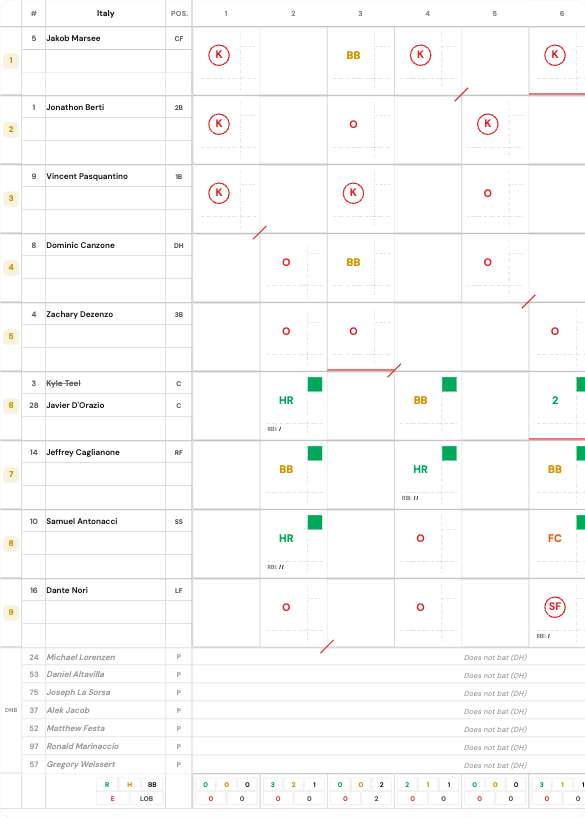
The Grid
The scoring grid has rows for each player in the batting order and columns for each inning. On the left you see:
- # — Jersey / uniform number
- Name — Player name
- Pos. — Fielding position (P, C, 1B, 2B, SS, 3B, LF, CF, RF, DH...)
On the right side of the grid are batting statistics columns (PA, R, H, 2B, 3B, HR, RBI, BB, K, and more). These update automatically as you score.
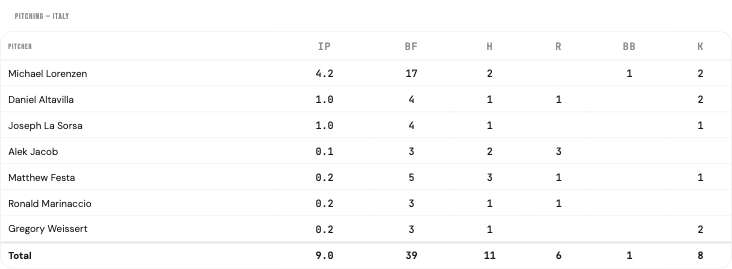
Pitcher Statistics
Below the scoring grid, a Pitcher Statistics section shows per-pitcher stats for the displayed team's own pitchers. The table displays one row per pitcher (ordered by appearance) with the following columns:
- IP — Innings Pitched
- BF — Batters Faced
- H — Hits
- R — Runs
- BB — Walks
- K — Strikeouts
A totals row at the bottom sums up all pitchers. When a pitcher change happens mid-game, each pitcher's stats reflect only the batters they faced. The pitcher stats section is also included in the printable version (Export PDF) for both teams.
Inning Columns
Each inning gets its own column. If all batters have batted in one inning and the inning is not over yet, the system automatically creates a continuation column marked with a "+" sign. Columns are added as needed — there is no limit.
Footer Stats
At the bottom of each inning column, a small grid shows the totals for that inning:
- R — Runs scored
- H — Hits
- BB — Walks
- E — Errors
- LOB — Runners left on base at the end of the inning

Away and Home Teams
At the top of the scoring sheet you will see tabs to switch between the Away and Home team. Each team has its own scoring grid. The currently displayed team is highlighted.

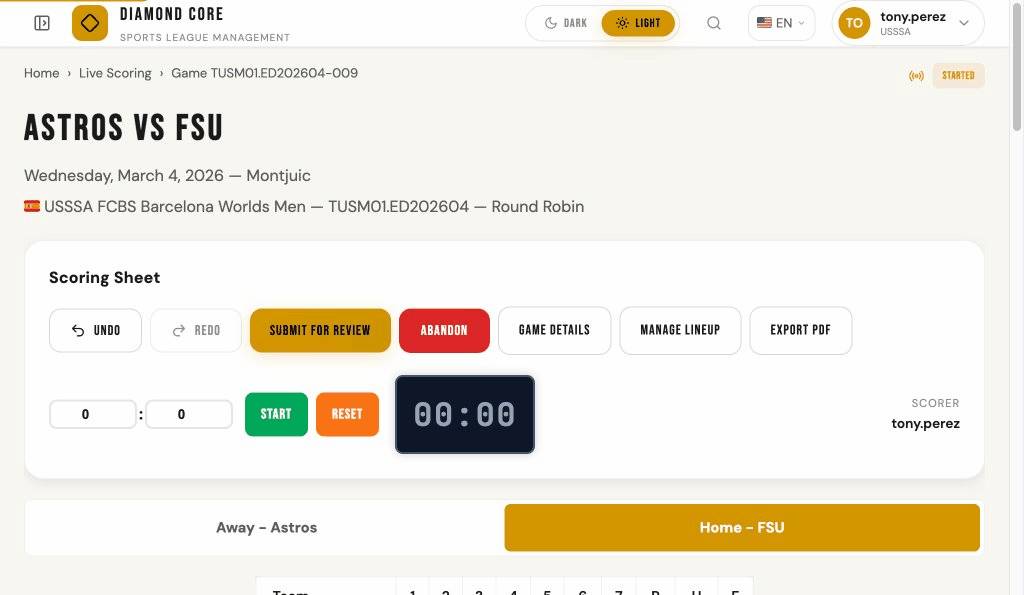
Scoring Sheet Controls
The scoring sheet header has several action buttons:
- Game Details — Navigate to the game detail page for this game.
- Manage Lineup — Open the lineup management page. This button is disabled when the game is finalized or the scoring sheet has been submitted, abandoned, or finalized (lineup changes are no longer allowed).
- Export PDF — Open a printable version of the scoring sheet.
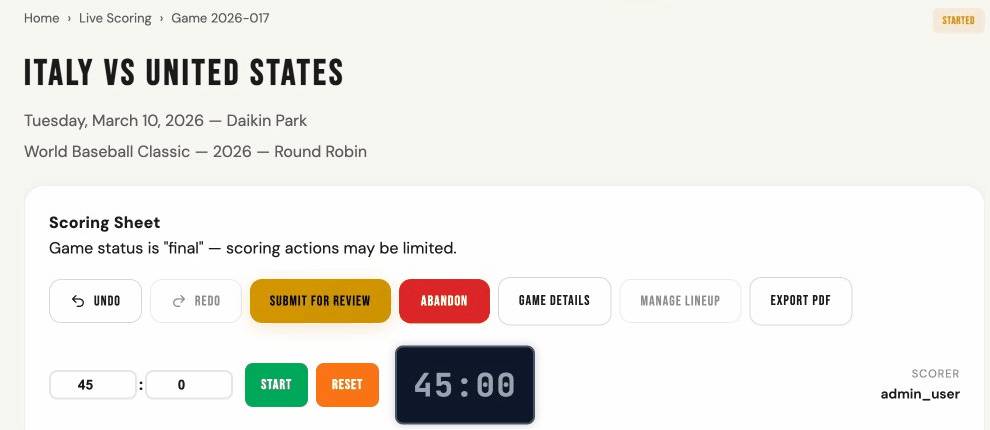
Scoring Sheet States
A scoring sheet moves through these stages:
- Created — The sheet exists but scoring has not started.
- Started — Scoring is active. You can record plays.
- Submitted — The scorer has finished and submitted the sheet for review. You can reopen a submitted sheet to make corrections before finalization.
- Finalized — The sheet is locked. No more changes can be made.
A scoring sheet can also be Abandoned at any time before it is submitted. Abandoning a sheet means the scoring session is discarded. The game score, statistics, and rankings are not updated. The game remains in its current status (usually Live). An abandoned sheet can be resurrected using the Resurrect button, which returns it to the Created state so scoring can be restarted.
Auto-Save Indicator
When you record a play, undo, redo, or perform any scoring action, a status indicator appears near the game timer showing the save progress:
- Saving... — The action is being sent to the server. A spinning icon is shown.
- All changes saved — The server confirmed the action was saved successfully. Shows a check mark and the time.
- Save failed — retrying — A network error occurred. The system will automatically retry up to 3 times.
- Save failed — All retry attempts failed. Check your network connection and try the action again.
What Happens When You Finalize
When a scoring sheet is finalized, the system automatically:
- Locks the scoring sheet — no more changes can be made.
- Syncs the final game score (runs, hits, errors per inning) to the game record.
- Refreshes batting statistics — all player and team batting stats are recomputed.
- Refreshes pitching statistics — all pitcher stats are recomputed.
- Calculates rankings — both teams' Elo ranking points are updated based on the game result.
This means statistics, rankings, and game scores on all pages are updated immediately after finalization. There is no delay or background process.
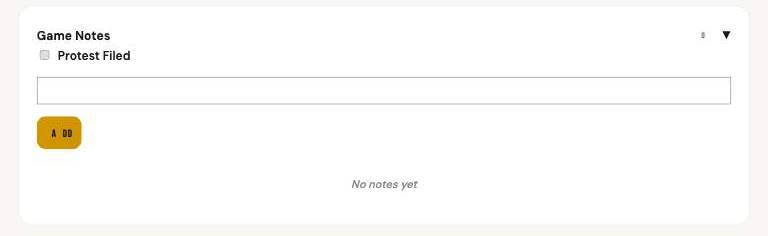
Game Notes & Protests
The Game Notes panel on the scoring sheet lets you record free-text observations during a game — such as weather conditions, incidents, rule disputes, or any other notable information.
- Opening the panel: Click the "Game Notes" header below the Event History section. The panel remembers whether it was open or closed.
- Adding a note: Type your observation in the text area and click Add. Notes are timestamped and attributed to the current user.
- Filing a protest: Check the "Protest Filed" checkbox to flag the game as protested. This adds a red Protest badge to the scoring sheet, game lists, game detail, and box score pages. Uncheck to remove the flag. Protests can only be changed while scoring is in progress (started state).
- Viewing notes: Notes appear read-only on the Game Detail, Box Score, and printed/exported scoring sheet pages.
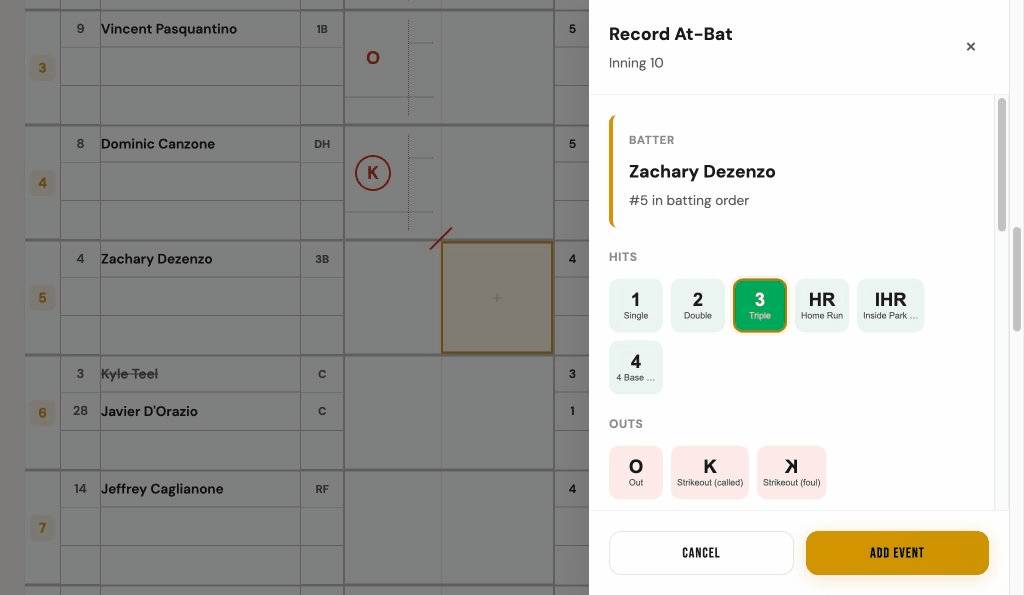
6. RECORDING PLAYS
To record a play, click the next empty cell in the scoring grid (highlighted with a dashed border). A panel will appear with buttons for the type of play.
Play Types
Hits
- Single (1) — Batter reaches first base on a hit.
- Double (2) — Batter reaches second base on a hit.
- Triple (3) — Batter reaches third base on a hit.
- Home Run (HR) — Batter hits the ball out of the park and scores.
- Inside-the-Park Home Run (IHR) — Batter circles all bases and scores without the ball leaving the field.
- Four-Base Award (4) — Batter is awarded all four bases (ground-rule).
Outs
- Out (O) — Batter is retired (fly out, ground out, etc.).
- Strikeout (K) — Batter strikes out on a called third strike.
- Strikeout Foul (K) — Batter strikes out on a foul ball.
Walks
- Walk (BB) — Batter receives four balls and goes to first base.
- Intentional Walk (IBB) — Pitcher deliberately walks the batter.
Other
- Fielder's Choice (FC) — Batter reaches base; the fielder chose to attempt an out on a different runner (see Special Plays).
- Sacrifice Fly (SF) — Batter flies out, but a runner scores.
- Error (E) — Batter reaches base because a fielder made an error.
- Lost Turn (LT) — A batter missed their turn at bat and the opposing team did not appeal. This is a scoresheet notation only — it does not count as a plate appearance, at-bat, or out, and has no effect on any statistics.
Runs Batted In (RBI)
When recording a play, you can set the number of RBI (runs batted in). This is the number of runners who scored because of the batter's action.
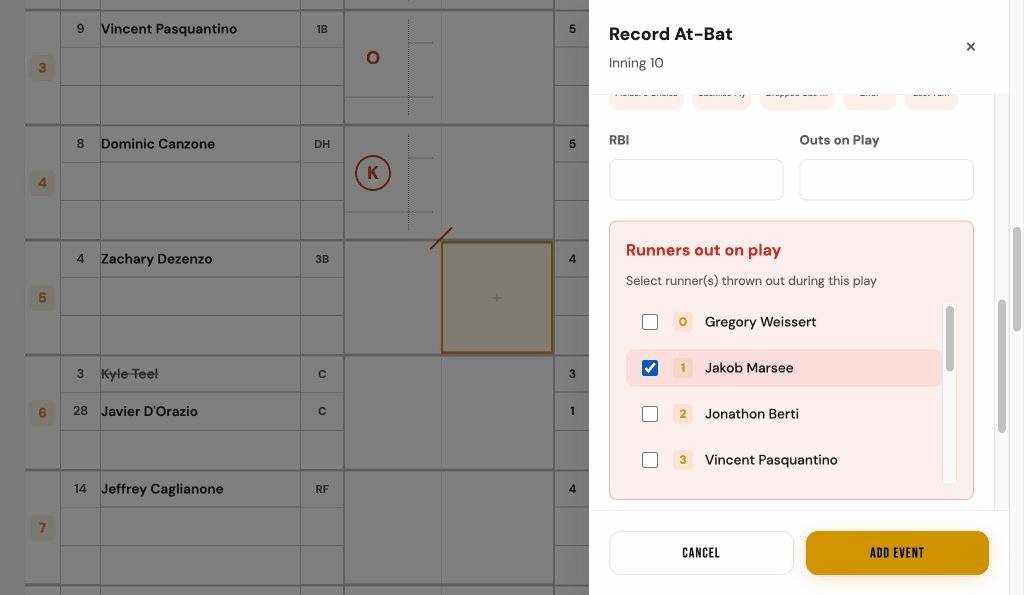
Runners Who Scored
If runners score on the play, the system shows checkboxes with the names of runners currently on base. Check the box next to each runner who scored on this play.
Bases-Full Warning
When the bases are loaded (3 runners on base) and you record a reach-base event (Single, Double, Triple, Walk, Intentional Walk, Error, or Fielder's Choice) without selecting which runners scored or were put out, the system shows an orange warning: "Bases full — select which runners scored or were put out." The panel stays open with your selections preserved. Check the appropriate runners in "Who scored?" or "Runners out on play" and the warning dismisses automatically. Home Runs and forced walks handle runner accounting automatically and do not trigger this warning.
Inning Sequence Enforcement
The scoring sheet enforces strict baseball/softball inning sequence: Top 1 → Bottom 1 → Top 2 → Bottom 2, and so on. Only the current cell (next batter in the rotation) is clickable. All other empty cells appear locked and grayed out.
When three outs have been recorded in an inning, the system automatically switches to the opposing team's scoring sheet and advances to the next inning.
If you navigate to the wrong team's tab, a banner will appear indicating which team is currently batting and providing a link to switch to the correct tab. No cells will be clickable on the wrong team's tab.
To correct a mistake, void the incorrect event (click on the filled cell and choose Void). The voided cell appears with a dashed amber border — click it to re-enter the play. The gold cursor stays at the normal scoring position so you can continue scoring. Multiple gaps can be visible at once and filled in any order. The scoring sheet cannot be submitted while unfilled gaps remain.
If filling a gap creates 3 outs in that inning and events were recorded after the gap, a dialog will ask whether to remove the subsequent events or cancel the gap-fill.
Editing a Play
To review or change a play you already recorded, click on that cell. A panel will show the details and options for that event, including the ability to void (cancel) the play if needed.
Undo / Redo
The Undo button in the toolbar voids the last recorded event for the active team. This is a quick way to reverse a mistake without navigating to the cell. Undo is only available while the scoring sheet is in the "Started" state.
The Redo button restores the most recently undone event. Redo is not available if new events have been added after the undo. You can also use Ctrl+Z (Undo) and Ctrl+Shift+Z (Redo) keyboard shortcuts. On Mac, use Cmd instead of Ctrl.
Event History
Below the scoring grid, you can expand the Event History panel. This shows a table of every play recorded so far — including substitutions and re-entries — in reverse order (newest first). Lineup changes appear with a purple badge (SUB for substitutions, RE for re-entries) and show which player was replaced. You can choose how many events to show per page (10, 25, or 50). Click any column header to sort the table by that column (click again to reverse the sort direction). The panel remembers whether you left it open or closed.
7. SPECIAL PLAYS
Fielder's Choice (FC)
A fielder's choice means the batter reached base safely because a fielder chose to attempt an out on a different runner. The runner may or may not actually be put out.
- Record the FC event for the batter from the Other category.
- A Runners out on play section appears with checkboxes for each runner on base. If a runner was put out on the play, check that runner. You can optionally select the base where the out occurred using the dropdown next to each runner.
- Click Submit to record the event. A purple curved line will connect the FC cell to the runner's cell and a red circle will appear on the runner's cell to indicate the out.
- If no runner was put out (everyone safe), simply submit without checking any runner.
Double Play / Triple Play
When a batter makes an out and one or more runners are also put out on the same play:
- Record the out event for the batter (Out, Strikeout, Sacrifice, etc.).
- Set the Outs on Play field to 2 (for a double play) or 3 (for a triple play).
- A section called Runners Out on Play will appear. Check the box next to each runner who was also put out.
Curved connector lines will appear between the batter's cell and each runner cell that was put out, just like with a fielder's choice.
Courtesy Runner
Some leagues allow a courtesy runner to replace a batter on the bases. When recording a play, check the Courtesy runner used option, then select the player who ran. The cell will show "CR" and the runner's jersey number in the corner. Runs still count for the original batter, not the courtesy runner.
Limit: Only one courtesy runner is allowed for non-pitchers per half-inning. Pitchers can use courtesy runners without limit. If a non-pitcher has already used a courtesy runner in the current half-inning, the option will be disabled for other non-pitcher batters until the next inning.
Run Scored
When a runner scores, their original cell in the grid gets a small box filled in the top-right corner. This is the standard way scoring sheets show that a run was scored.
8. LINEUPS AND SUBSTITUTIONS
Lineup Game Selection
Click Lineup in the sidebar (or on the landing page) to open the Lineup game selection page. This page lists all games with the same filters and sorting as the Games page. Each row shows a Lineup column with H (Home) and A (Away) indicators — a green check mark means that team's lineup has been initialized, and a dash means it has not. Click any game row to open the lineup management page for that game.
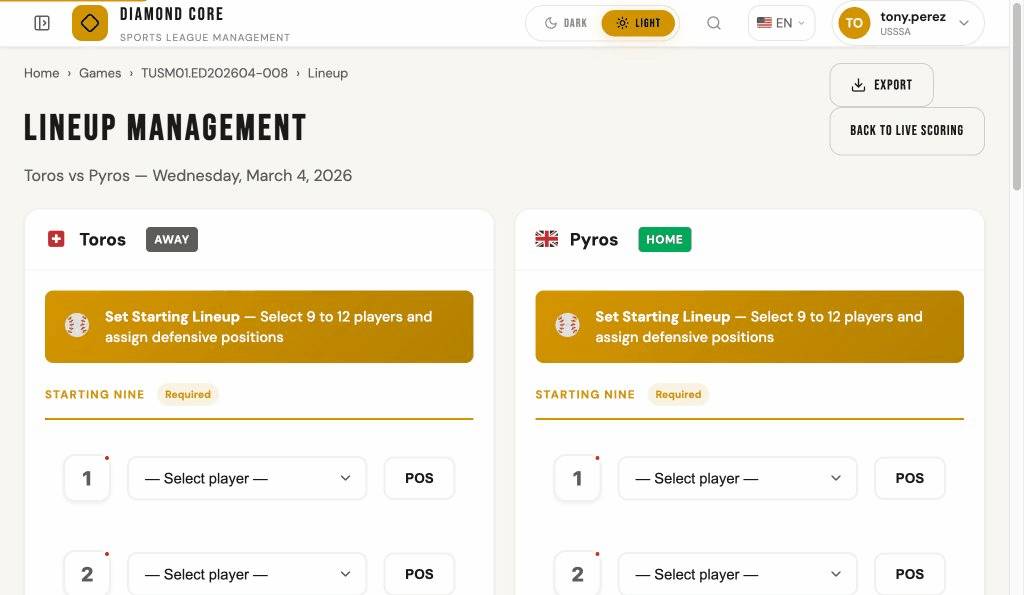
Setting Up the Lineup
Before scoring can begin, both teams need a lineup. From the scoring sheet, if lineups are missing, you will see a Set Starting Lineup button. Click it to open the lineup management page. You can also navigate directly from the Lineup game selection page.
For each team, select the players from the roster and assign them a batting order (1 through 9 or more) and a fielding position. You must also designate the starting pitcher.
If you need to change the lineup before scoring starts, click Edit Lineup on the lineup management page. This re-opens the initialization form pre-populated with the current lineup. After making your changes and saving, the old lineup is replaced with the updated one.
Once a game is Live, the lineup page becomes read-only. All lineup changes (substitutions, position changes) must be made through the Scoring Sheet. A banner on the lineup page provides a direct link to the scoring sheet. Superusers retain override access to edit lineups directly during live games.
On finalized or read-only lineups, clicking any player name (including substituted players and pitcher history) opens the Player Detail modal window showing their tournament stats, game log, and biography.
Making a Substitution
During the game, click the Substitute Player button on the scoring sheet. Choose the player leaving the game and the replacement player from the bench. Set the inning and position for the new player.
Substituted players are shown with a line through their name in the grid. The new player appears in a new row with a marker showing when they entered the game.
Re-entry
If the league rules allow it, a player who was substituted out can re-enter the game. The system tracks which players are eligible for re-entry and displays them when needed.
Designated Hitter (DH)
When the DH rule is enabled, a team may designate one player (the DH) to bat in place of another player. During lineup initialization, assign a player to the DH position, then use the DH Bats For dropdown to select which player the DH will replace in the batting order. The selected player will play defense only and be marked as Does not bat (DNB). The DH can bat for any player, not just the pitcher.
On the scoring grid, the DNB player appears at the bottom of the lineup in a greyed-out row with no scoring cells. Their batting order shows DNB instead of a number.
On the lineup management page, a DH Active badge is shown when the DH rule is in effect. The DH player's row shows the DH annotation, and the replaced player's row is marked as DNB.
Pitcher Changes
To change the pitcher, use the Change Pitcher button in the pitcher area of the scoring sheet. The pitcher change panel shows two sections:
- From Lineup — Current lineup players who can swap positions with the pitcher.
- From Bullpen — Roster players not yet in the game. Selecting a bullpen pitcher creates a substitution: the old pitcher leaves the game and the new pitcher enters at the same batting order position.
The IP (innings pitched) display shows the current pitcher's individual IP, not the total team pitching. When a pitcher change occurs, a red horizontal line appears at the bottom of the last batter's cell that the departing pitcher faced, following standard scoring convention.
Undoing Pitcher Changes and Substitutions
If you made a pitcher change or player substitution by mistake, you can undo it as long as no scoring events have been recorded since the change.
- Undo Pitcher Change — Open the pitcher change panel and click the Undo Pitcher Change button at the bottom of the panel. A confirmation prompt will appear.
- Undo Substitution — Open the substitution panel and click the Undo Substitution button at the bottom of the panel. A confirmation prompt will appear.
The undo buttons only appear when an undo is possible (i.e., no scoring events have been recorded since the change). Once any play is recorded after the change, the undo option is no longer available.
Pitcher History
On the lineup management page, below the Current Pitcher card, a Pitcher History section appears when more than one pitcher has entered the game. Pitchers are listed in order of appearance — the starting pitcher first (marked with an SP badge), followed by each reliever with an indicator showing the inning they entered (e.g., T4, B3). This section is only visible when there have been pitcher changes.
Lineup Export
The lineup management page includes an Export dropdown button in the page header. It offers three export formats:
- Print / PDF — Opens a print-friendly page with the full lineup card (game header, batting lineups with substitution history, pitchers in order of appearance, and bench players). Use your browser's print dialog to save as PDF.
- Excel (.xlsx) — Downloads a spreadsheet with the same information, formatted with headers and column widths for easy reading.
- CSV — Downloads a plain-text comma-separated file that opens in any spreadsheet application.
All export formats include: tournament and game header, batting lineup with substitution history for both teams, pitcher history in order of appearance, and bench players (roster players not in the lineup).
9. GAME TIMER
Some tournaments use a time limit for games. Diamond Core includes a countdown timer that you can use during the game.
Using the Timer
The timer appears on the game detail page (and inside the scoring sheet). You can set the number of minutes and seconds, then use the buttons to control it:
- Start — Begins the countdown.
- Break — Pauses the timer (for rain delays, breaks, etc.).
- Resume — Resumes the countdown after a break.
- Reset — Sets the timer back to its starting value.
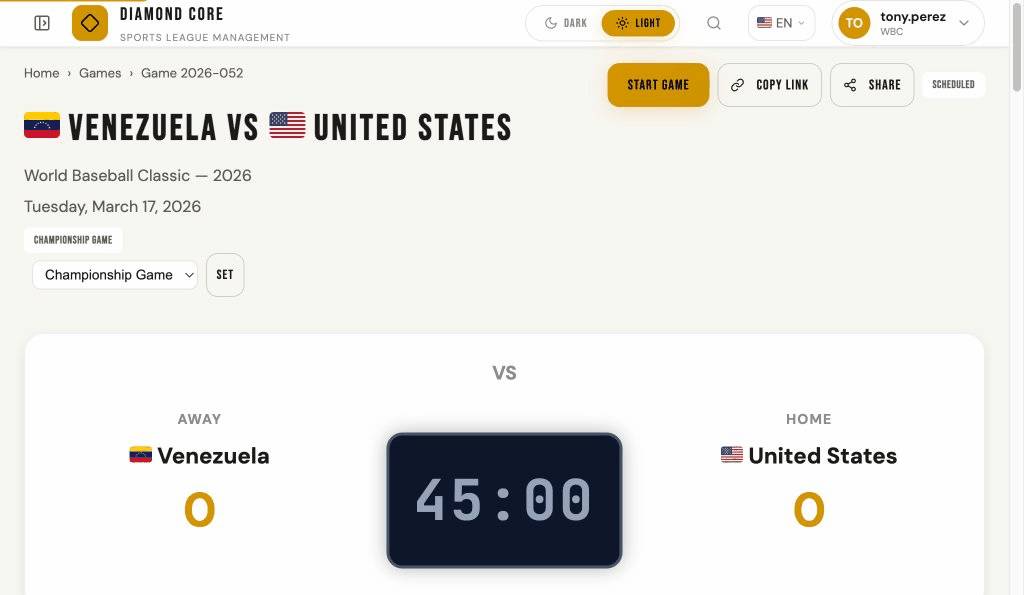
Color Coding
The timer display changes color based on how much time is left:
- Green — More than 5 minutes remaining.
- Yellow — Between 1 and 5 minutes remaining.
- Red (pulsing) — Less than 1 minute remaining.
When the timer reaches zero, a sound plays and a banner appears to let everyone know that time is up.
10. BOX SCORES
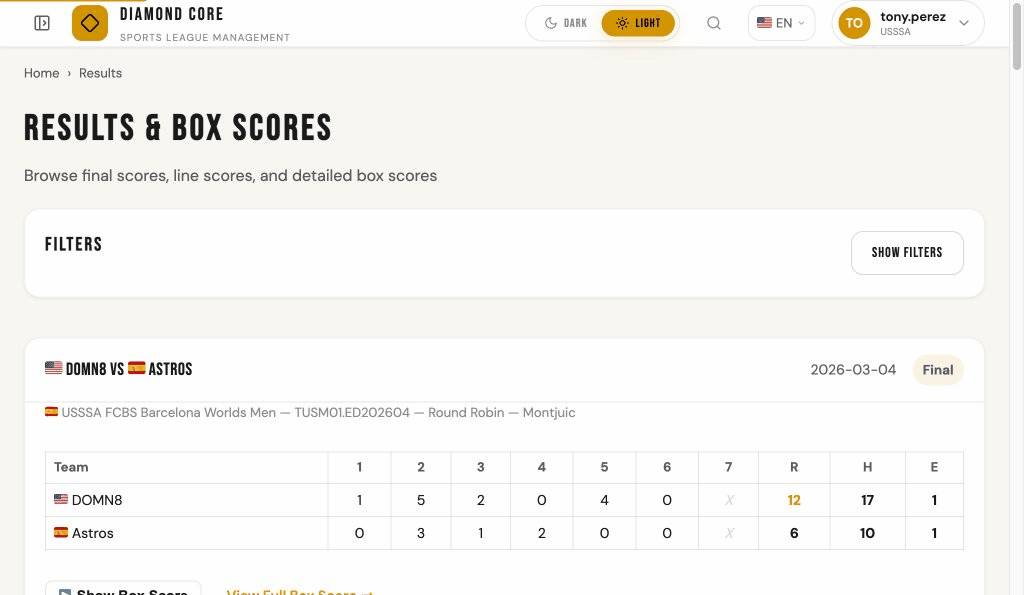
Results & Box Scores Page
Click Results in the sidebar (or on the landing page) to browse game results. By default, the page shows Final and Live games. Each game appears as a card with the inning-by-inning line score (Runs, Hits, Errors) always visible.
If a game has scoring data, a Show Box Score button lets you expand a compact box score right on the card — showing batting stats (AB, R, H, HR, BB, RBI) and pitching stats (IP, BF, H, R, BB, K) for both teams. Click the button again to collapse it. A View Full Box Score link takes you to the detailed box score page.
Click Show Filters to expand the filter panel. You can narrow results by season, tournament, edition, gender, country, venue, club, or status. You can clear the default status filter to see all games. When filters are active and the panel is collapsed, a badge shows the count. Active filter pills appear below the panel; click Clear All Filters to reset.
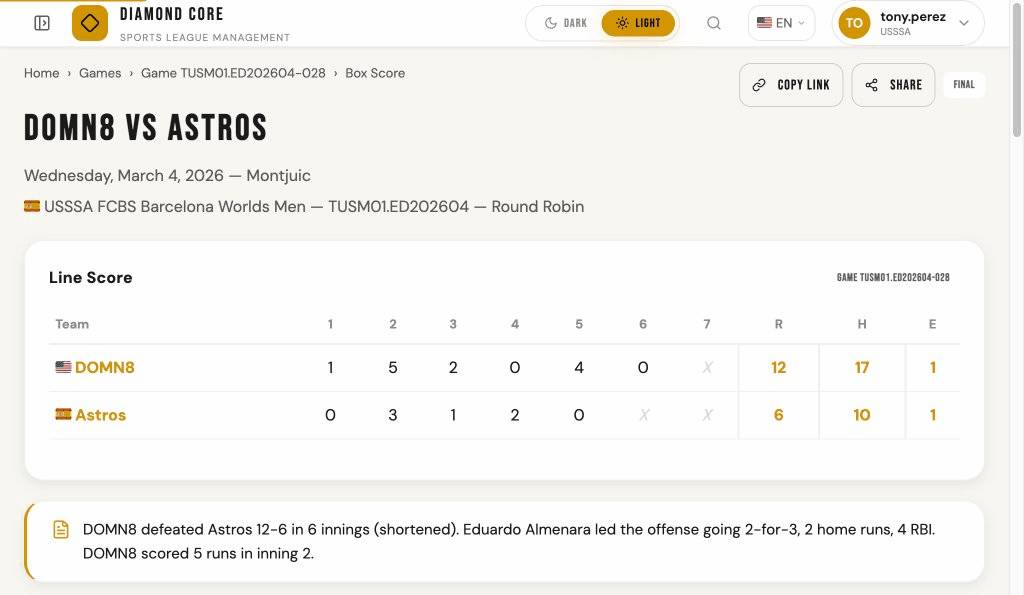
Game Recap
At the top of the game detail and box score pages for finalized games, a Game Recap provides a brief text summary of the game. The recap includes:
- Winner and Loser — The winning team and final score.
- Score Margin Description — Word choice reflects how decisive the victory was (dominated, defeated, beat, edged, topped).
- Innings Played — Number of innings (if different from regulation).
- MVP / Top Performer — The winning team's top batter with their hitting statistics (e.g., "Alice Johnson led the offense going 3-for-4, a home run, 2 RBI").
- Star Pitcher — The winning team's best pitcher with innings pitched, strikeouts, and runs allowed (e.g., "Maria Lopez pitched 6.0 innings, 8 strikeouts"). A pitcher must have pitched at least 1 full inning to qualify.
- Big Inning — If a team scored 4 or more runs in a single inning, that inning is highlighted in the recap.
The recap is displayed for final games only. Games that are scheduled, live, canceled, or postponed will not show a recap.
Full Box Score Page
The box score page gives a summary of a completed (or in-progress) game. You can reach it from the game detail page or from the Results & Box Scores page.
The box score shows:
- Game Recap — A natural-language summary of the finalized game (see "Game Recap" section above).
- Line Score — Runs per inning for both teams, plus total Runs (R), Hits (H), and Errors (E). Innings that were not played are displayed as “X” in italic muted text; hover over them to see a “Not played” tooltip. When the home team wins without needing to bat in the last inning (walk-off rule), the bottom of that inning shows “X” instead of “0”.
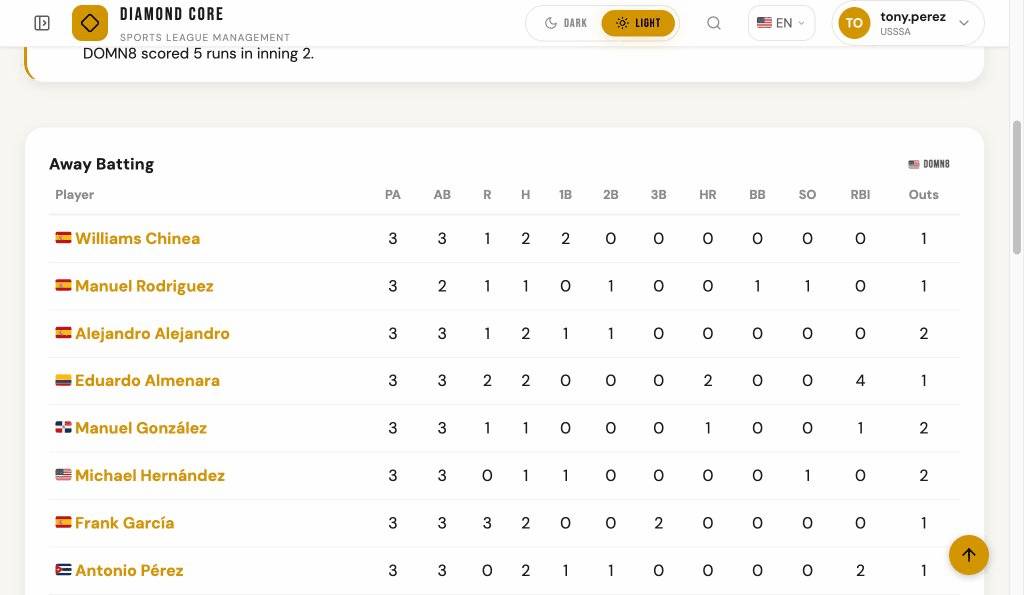
- Player Statistics — Individual batting stats for each player who appeared in the game.
Player Detail: Click any player name (shown in gold) in the box score tables to open a detail modal showing the player's profile, tournament stats (batting and pitching), game log, biography, and sanctions. This works on the compact box score (Results page), the full Box Score page, Game Detail lineups, and the Statistics pages.
11. STATISTICS
The Statistics page provides an interactive explorer for batting and pitching statistics aggregated from all finalized scoring sheets. Statistics are computed from play-by-play scoring data and refreshed automatically when a game is finalized.
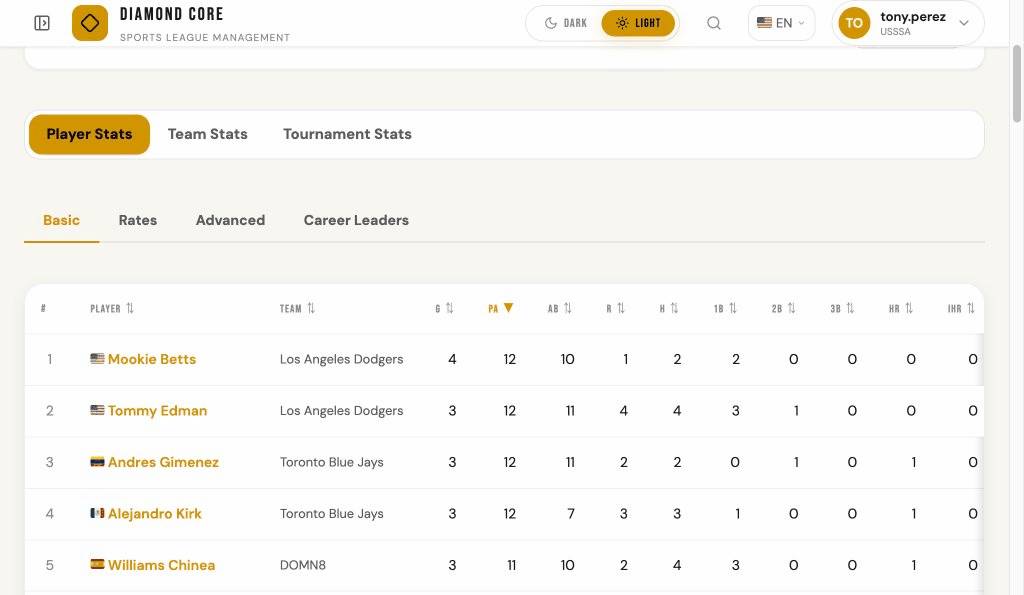
Aggregation Levels
Use the level selector at the top of the page to choose how statistics are grouped:
- Player Stats — Individual player statistics per tournament edition and team
- Team Stats — Team-level aggregates per tournament edition. Each team shows its country flag. Click any team name to view its Global Rankings detail page.
- Tournament Stats — Tournament-wide totals across all teams. Each tournament shows its host country flag.
Stat Tabs
- Basic — Counting stats: G, PA, AB, R, H, 1B, 2B, 3B, HR, IHR, 4B, RBI, BB, IBB, K, SF
- Rates — Rate stats: AVG (batting average), OBP (on-base percentage), SLG (slugging), OPS (on-base plus slugging)
- Advanced — Advanced metrics: ISO (isolated power), BABIP (batting average on balls in play), wOBA (weighted on-base average)
- Career Leaders — All-time leaders aggregated across all tournaments
Filters
Click Show Filters to expand the filter panel. You can narrow results by Tournament Edition, Team, Gender, Phase (game type), Home/Away, Date Range, or minimum plate appearances (Min PA). When filters are active and the panel is collapsed, a badge shows the count. Active filter pills appear below the panel; click Clear All Filters to reset.
Sorting
Click any column header to sort the table by that stat in descending order. Click again to reverse the sort direction. You can also sort by player name, team name, or tournament name — click those column headers the same way.
Player Detail
When viewing player-level statistics, click any player name to open a detail modal showing the player's profile, tournament stats (batting and pitching), game log, biography, and sanctions.
Min PA Qualification
Use the Min PA filter to set a minimum number of plate appearances. This is useful for rate stats (AVG, OBP, etc.) where small sample sizes can be misleading.
When Stats Are Refreshed
Statistics are refreshed in two ways:
- Automatically — Every time a scoring sheet is finalized, all batting and pitching statistics are immediately recomputed from the play-by-play data of all finalized games.
- Manually — Administrators can click the "Refresh Stats" button at the top of the Statistics page to trigger an immediate refresh. This is useful if data corrections were made outside the normal workflow.
Statistics are computed from materialized views in the database. They always reflect the latest finalized game data.
Batting Charts
Below the statistics table, a charts dashboard provides visual summaries of the batting data. All charts respond to the same filters applied to the table above.
- Top Batters by OPS — Horizontal bar chart showing the top 15 batters ranked by OPS (On-base Plus Slugging), split into OBP and SLG components.
- Team Batting Comparison — Grouped bar chart comparing each team's AVG, OBP, and SLG side by side.
- Hit Distribution — Donut chart showing the breakdown of all hits by type: Singles, Doubles, Triples, and Home Runs.
- Plate Discipline — Bubble chart plotting each player's walk rate (BB%) against strikeout rate (K%), with bubble size proportional to plate appearances.
- Runs vs Hits — Combo chart with bars for Hits and RBI per team, and a line overlay for Runs scored.
- Batting Average by Inning — Line chart showing the team or league batting average for each inning, revealing when lineups tend to be hottest.
- Outcome Heatmap — Color-coded grid showing the count of each plate appearance outcome (Hit, Walk, Strikeout, Sacrifice, Other Out) per inning.
Charts adapt to dark and light mode automatically. If no data is available for a chart, a "No chart data available" message is displayed in its place.
Pitching Statistics
The Pitching Statistics page shows statistics from the pitcher's perspective. Pitcher attribution is computed automatically: for each plate appearance, the system identifies which pitcher was active for the opposing team at the time of the event.
Pitching Stat Tabs
- Basic — Counting stats: G, IP, BF, H, R, BB, IBB, K, HR, IHR
- Rates — Rate stats: RA (run average, 7-inning base), WHIP, H/9, BB/9, K/9, K/BB
- Advanced — Advanced metrics: RA, WHIP, H/9, K/9, BB/9, K/BB
Min IP Qualification
Use the Min IP filter to set a minimum number of innings pitched. This is useful for rate stats (RA, WHIP, etc.) where small sample sizes can be misleading. Options: No minimum, 1+ IP, 3+ IP, 7+ IP, 14+ IP.
Pitching Charts
Below the pitching statistics table, a charts dashboard provides visual summaries of the pitching data. All charts respond to the same filters applied to the table above.
- Top Pitchers by RA — Horizontal bar chart showing the top 15 pitchers ranked by lowest Run Average (min 3+ IP).
- Team Pitching Comparison — Grouped bar chart comparing each team's RA, WHIP, and K/9 side by side.
- Pitch Outcomes — Donut chart showing the breakdown of all plate appearance outcomes: Strikeouts, Walks, Hits, and Other Outs.
- Pitcher Workload — Bubble chart plotting each pitcher's IP against K/9, with bubble size proportional to batters faced.
- RA by Inning — Line chart showing the runs allowed rate per inning across all pitchers.
- K/BB Rate — Scatter chart plotting each pitcher's strikeout rate against walk rate per batter faced.
Stat Tooltips
Hover over any statistical column header (PA, AB, AVG, OBP, WHIP, etc.) to see a tooltip explaining what the abbreviation means. This works on the scoring sheet, box scores, statistics pages, standings, and player detail modals.
12. STANDINGS
Click Standings in the sidebar (or on the landing page) to view tournament standings. The page shows Win-Loss-Tie records computed in real time from game results.
How Standings Are Computed
Standings are computed in real time every time you open the page — there is no caching or delay. The system calculates Win-Loss-Tie records directly from game results, including games that are currently live. This means standings always reflect the very latest scores, even during an in-progress game.
Unlike statistics and rankings (which are refreshed when a game is finalized), standings do not require finalization to update.
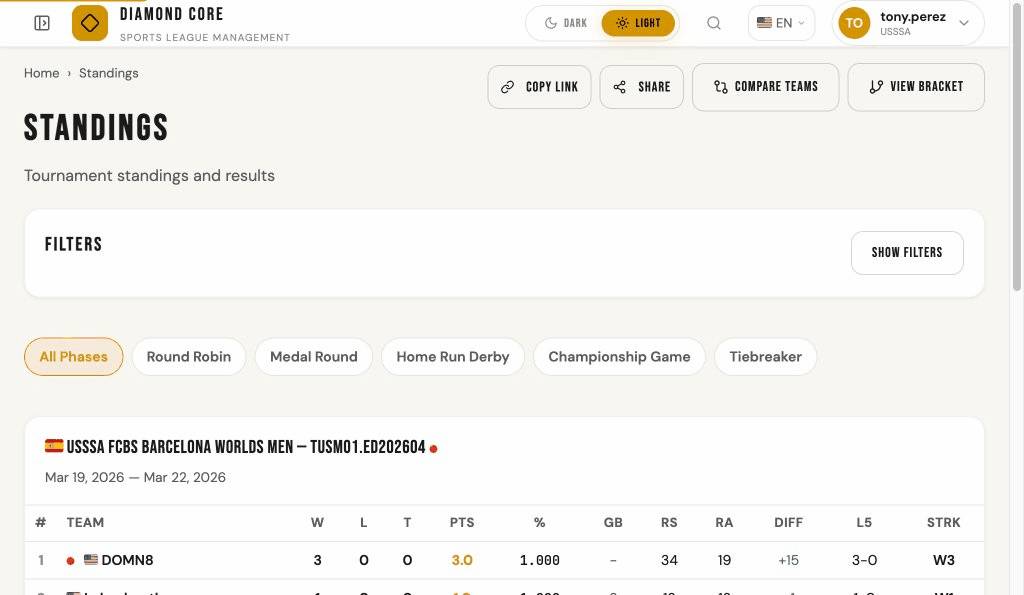
Standings Table
Each tournament edition is displayed as a card with a standings table. The table columns are:
- # — Rank position
- Team — Club name with country flag. Click any team name to view its Global Rankings detail page, including Elo rating history and charts.
- W-L-T — Wins, Losses, and Ties
- Pts — Points (Win = 1, Tie = 0.5)
- % — Winning percentage (Points / Games Played)
- GB — Games behind the leader
- RS / RA — Runs Scored and Runs Allowed
- Diff — Run Differential (RS - RA)
- L5 — Record over the last 5 games
- Strk — Current streak (e.g., W4 = 4 consecutive wins)
By default, teams are ranked by points (descending), then head-to-head record among tied teams, then run differential. This is the "Head-to-head, then run differential" tiebreaker rule.
Tiebreaker Rules
Administrators can configure a tiebreaker rule per tournament phase (in Setup > Phases). The available rules are:
- Head-to-head, then run differential (default) — Teams are sorted by total points (Win = 1, Tie = 0.5). When teams have the same points, tiebreakers are applied in order: (1) head-to-head record among tied teams, (2) run differential (RS - RA).
- Run differential only — Teams are sorted by total points. When tied, run differential is used directly (no head-to-head check).
- WBC (World Baseball Classic rules) — Teams are sorted by winning percentage (wins / games played) instead of total points. This means a team with fewer games played but a better win rate ranks higher. When teams have the same winning percentage, tiebreakers are applied in order: (1) head-to-head record among tied teams, (2) fewest runs allowed in games among tied teams, (3) run differential in games among tied teams, (4) fewest runs allowed in all pool games, (5) run differential in all pool games, (6) pre-tournament seed number (lower seed = higher rank).
- Custom — Administrators define their own tiebreaker order by selecting from these criteria and arranging them in priority order: head-to-head record, run differential (overall), run differential (among tied teams), runs allowed (overall), runs allowed (among tied teams), winning percentage, runs scored (overall), and pre-tournament seed number. When "Custom" is selected, the form shows a list where you can add criteria, reorder them with arrow buttons, and remove them. The first criterion is tried first; if teams are still tied, the next criterion is applied, and so on.
When the WBC rule is active, the pool standings table shows a PCT column (winning percentage, shown as a three-decimal value like .667) instead of the Pts column.
Unresolvable Ties and Tiebreaker Games
When all tiebreaker criteria have been exhausted and teams remain tied at the advancement boundary (the cutoff between teams that advance and those that don't), the system detects the situation and alerts the administrator.
An alert banner appears on the pool games page in Setup showing which teams are tied and how many can advance. The administrator has two options to resolve the tie:
- Tiebreaker Game — Create a special tiebreaker game between the tied teams. The game is marked with the "Tiebreaker" game type and does not affect the regular pool standings. Once finalized, the winner is placed ahead of the loser and advancement proceeds normally.
- Manual Resolution — Resolve the tie without playing a game (e.g., coin toss, lot draw). The administrator selects the resolution method, orders the teams, and provides an optional note. The system records the resolution and proceeds with advancement.
Tiebreaker games are excluded from regular standings calculations — they only serve to break the specific tie. Teams that are tied share the same rank number in the standings display (e.g., two teams at rank 2 instead of ranks 2 and 3).
Live Indicator
Teams with a game currently in progress show a red pulsing dot next to their name. Live game scores are included in the standings calculation.
Filters and Phases
Click Show Filters to expand the filter panel. You can narrow standings by tournament, edition, currently-playing tournaments, or club name. When filters are active and the panel is collapsed, a badge shows the number of active filters. Active filter pills appear below the panel; click Clear All Filters to reset.
Phase tabs (e.g., Round Robin, Medal Round) appear below the filters when game types are configured. Click a tab to see standings for only that phase of the tournament.
Game Type (Phase)
Administrators can set a game's phase (e.g., Round Robin, Medal Round) from the game detail page using the phase dropdown below the tournament name. This allows filtering standings by tournament phase.
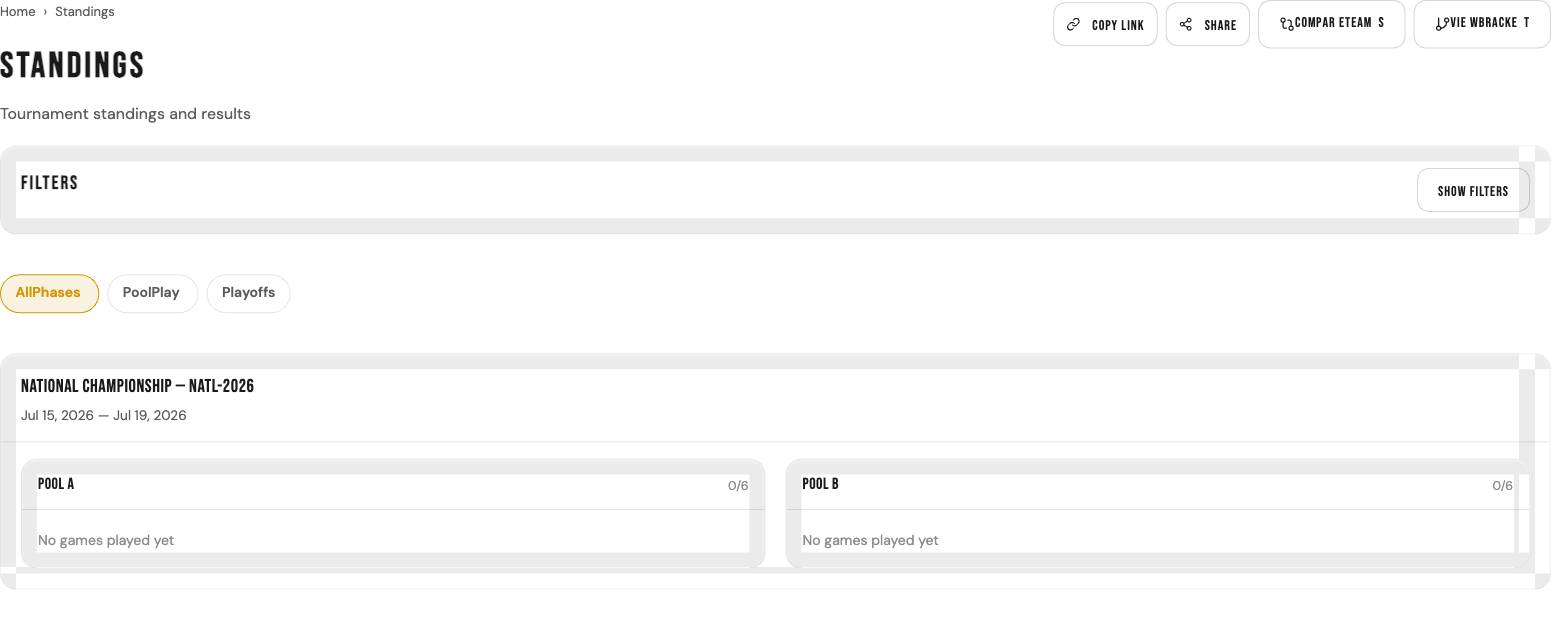
Pool Standings
When a tournament edition uses the multi-phase system with round-robin pools, the standings page shows per-pool standings cards. Each pool card displays a compact table with W-L-T records, points, and run differential for teams in that pool.
Pool cards show a completion badge: "Complete" (green) when all round-robin games have been finalized, or "In Progress" (amber) when some games are still pending. A game count (e.g., 4/6) shows how many games are finalized out of the total expected.
When the phase has an advancing count configured, the top N teams in each pool are highlighted with a green marker indicating they qualify to advance to the next phase. A hint below the table shows "Top N advance".
While pool play is still in progress, teams that have mathematically clinched advancement display an amber outlined checkmark (✓) next to their name. A team has clinched when it is guaranteed to finish in the top N positions regardless of how remaining games play out. A legend at the bottom of the pool card explains the checkmark symbol. Once all games are complete, the clinch indicator is replaced by the standard advancing highlight.
Use the Pool filter dropdown (in the filter panel) to view standings for a single pool. The overall combined standings table appears below the pool cards.
13. PLAYOFF BRACKET
Click Bracket in the sidebar to view the playoff bracket tree for elimination phases. The bracket displays match cards organized by round in a left-to-right tree layout, making it easy to track the progression of playoff competition.
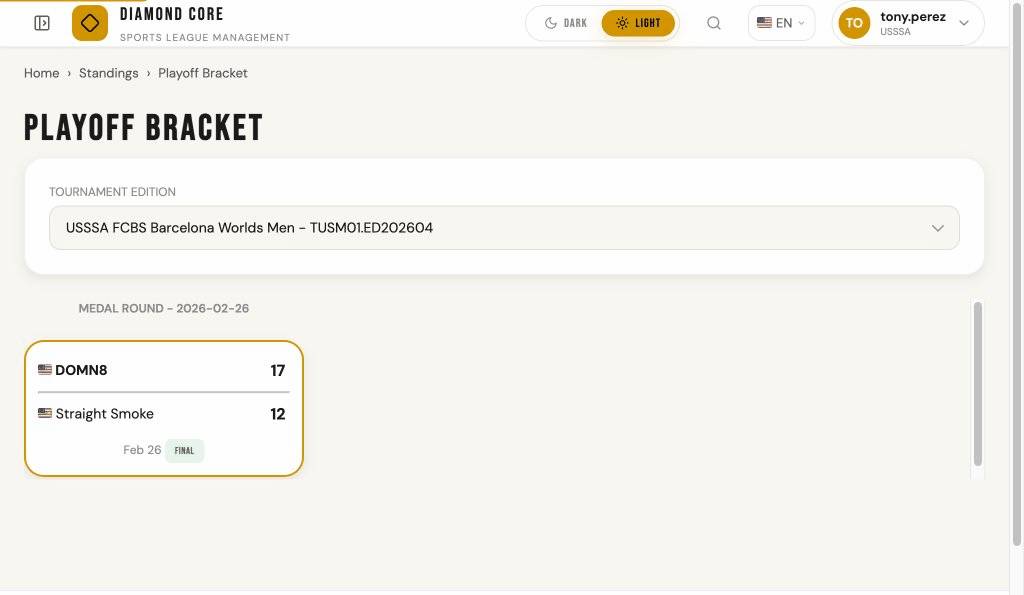
Tournament Selection
Use the Tournament Edition dropdown to select which tournament you want to view. The bracket will automatically refresh to display the elimination bracket for that tournament.
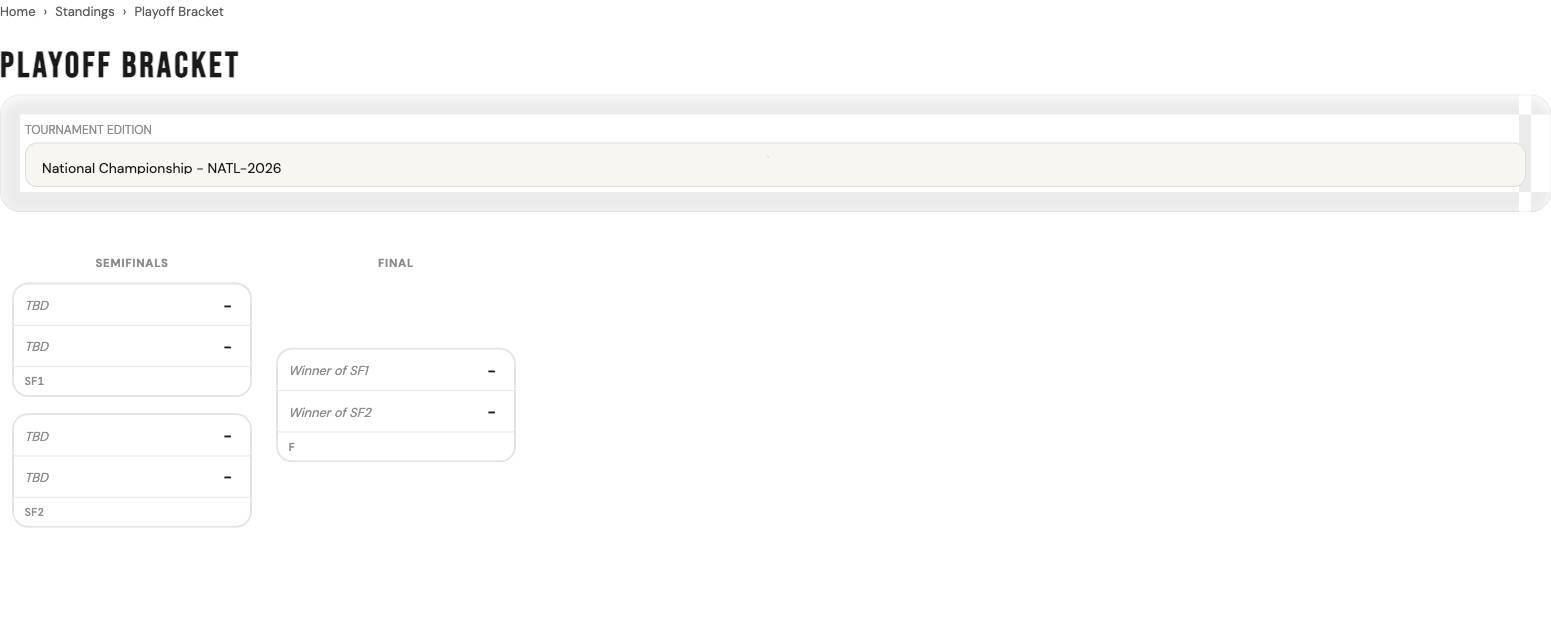
Bracket Display
Matches are displayed as cards organized by round (Quarterfinals, Semifinals, Final). Each card shows:
- Home Team — Country flag, team name, and score (or dash if not yet played)
- Away Team — Country flag, team name, and score (or dash if not yet played)
- Placeholder Labels — When teams are not yet determined, the card shows the source (e.g. "Winner of SF1")
- Clinched Badge — Teams assigned to a bracket match display an amber outlined checkmark (✓) next to their name while the game has not yet been decided. A legend below the bracket explains the symbol. Once the match is decided, the badge is removed.
- Winning Team — Highlighted in bold font
- Status Badge — Final (green), Live (red with pulsing dot), Ready, or Scheduled
- Match Code — Displayed in the card footer (e.g. SF1, F)
- Clickable Card — Click the entire match card to view full game details (when a game is linked)
Phase Selector
When a tournament has multiple elimination phases, tab buttons appear at the top to switch between them. Click a tab to view that phase's bracket.
Double Elimination
Double elimination brackets are split into three sections: Winners Bracket, Losers Bracket, and Championship. Each section displays its own bracket tree with round headers and match cards.
Rescheduling Bracket Matches
Admins can reschedule bracket matches directly from both the bracket visualization page and the setup bracket page. On the bracket visualization, hover over a match card and click the pencil icon in the footer to open the reschedule modal. On the setup bracket page, click the calendar icon in the Date column.
The reschedule modal lets you change the date, time, and venue. If a game has already been created for the match, the game's schedule is automatically updated to stay in sync. Matches with live or finalized games cannot be rescheduled.
14. GLOBAL RANKINGS
Global Rankings show how teams compare across tournaments using an Elo-based rating system. Unlike Standings (which show Win-Loss-Tie records within a single tournament), Rankings track each team's overall competitive strength over time.
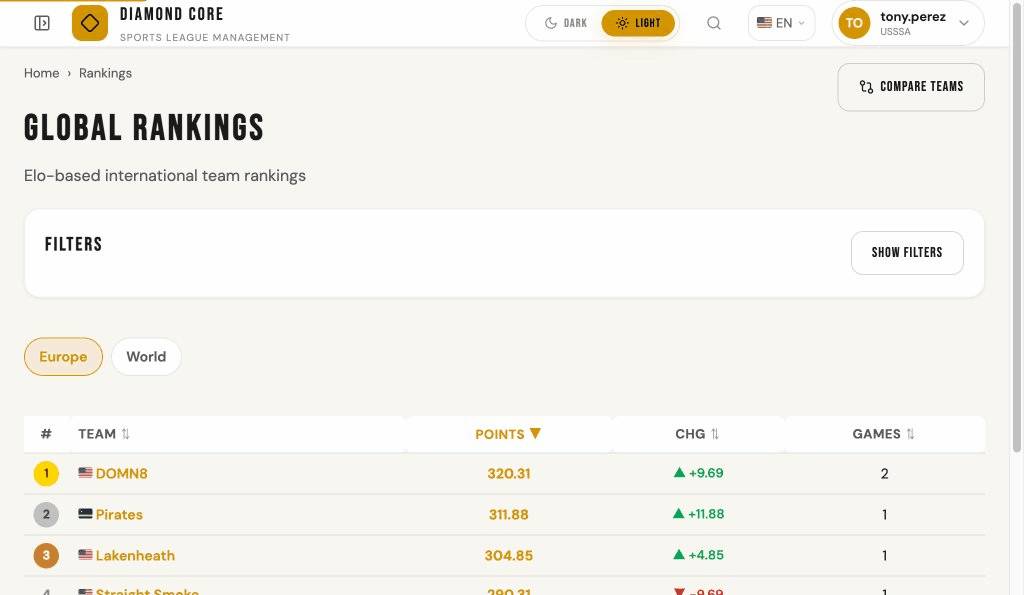
Viewing Rankings
Click Rankings in the sidebar or the Global Rankings card on the home page. The leaderboard shows all ranked teams ordered by their current Elo points.
Scope
Use the scope tabs to switch between Europe and World rankings. Europe rankings include only European tournaments. World rankings include all tournaments worldwide.
Searching for a Club
Use the Club Search filter to find a specific team by name. Type part of the club name and click Apply Filters to filter the leaderboard. Active filter pills appear below the panel; click Clear All Filters to reset.
How Rankings Work
Rankings use the Elo rating system, the same method used in chess, international football (FIFA), and many other sports. The core idea is simple: when you beat a strong opponent you gain more points, and when you lose to a weak opponent you lose more points. Over time, each team's rating settles at a number that reflects their true competitive strength.
Rankings are updated automatically every time a scoring sheet is finalized. A live or in-progress game does not affect rankings until the scoring sheet is finalized. Administrators can recalculate all rankings from the Setup page, which replays every finalized game in chronological order and recomputes all Elo points from scratch.
The Rating Formula — Step by Step
Every time a game is finalized, the system calculates how many points each team gains or loses using this formula:
Point change = Game Weight (I) × Margin Factor (S) × (Actual Result − Expected Result)
There are three pieces that go into this calculation. Let's walk through each one.
1. Game Weight (I) — How important is this game?
Every tournament is assigned a category by the administrator, and each category has a game weight number (called "I"). A higher number means games in that tournament move rankings more. For example:
- A major international championship might have I = 60
- A regional cup might have I = 40
- A local friendly league might have I = 10
This means winning a championship game moves your rating 6 times more than winning a friendly.
2. Margin Factor (S) — How big was the victory?
Winning by a large margin counts more than a narrow victory. The system uses the run difference (the absolute difference between the two teams' scores) to calculate a multiplier:
- 0 or 1 run difference — Multiplier = 1.0 (base value, no bonus)
- 2 run difference — Multiplier = 1.5 (50% bonus)
- 3 or more runs — Multiplier = (11 + run difference) ÷ 8
Some examples of how margin affects the multiplier:
- Win by 1 run (e.g., 3–2) → ×1.0
- Win by 2 runs (e.g., 5–3) → ×1.5
- Win by 3 runs (e.g., 7–4) → ×1.75
- Win by 5 runs (e.g., 8–3) → ×2.0
- Win by 10 runs (e.g., 12–2) → ×2.625
The multiplier grows gradually so a blowout counts more, but not overwhelmingly more. This rewards dominant performances without making a single lopsided game distort the rankings.
3. Expected Result — Who was favored to win?
This is the heart of the Elo system. Before each game, the system calculates the probability of winning for each team based on their current ratings. A team with a higher rating is expected to win more often.
The formula uses a 400-point scale: if one team is rated 400 points higher than the other, that team is expected to win roughly 10 out of every 11 games (about 91% of the time). If both teams have the same rating, each is expected to win 50% of the time.
Here are some common rating gaps and what they mean:
- 0 points apart — 50/50 chance (evenly matched)
- 100 points apart — Higher-rated team expected to win ~64% of the time
- 200 points apart — Higher-rated team expected to win ~76% of the time
- 400 points apart — Higher-rated team expected to win ~91% of the time
The key insight: beating a team you were already expected to beat earns you fewer points, while beating a team above your rating earns you more. Similarly, losing to a much weaker team costs you more than losing to a stronger one.
Worked Example
Let's walk through a real calculation so you can see exactly how it works.
Setup: Team Alpha has 1,500 points. Team Bravo has 1,300 points. They play in a championship (game weight I = 60). Final score: Alpha wins 6–3 (a 3-run margin).
Step 1 — Margin factor: The run difference is 3. Using the formula (11 + 3) ÷ 8 = 1.75.
Step 2 — Expected result: Alpha is 200 points above Bravo. The system calculates that Alpha has about a 76% chance of winning (expected result = 0.76). This means Bravo has a 24% chance (expected result = 0.24).
Step 3 — Actual result: Alpha won, so their actual result = 1.0. Bravo lost, so their actual result = 0.0. (A tie would give both teams 0.5.)
Step 4 — Calculate point change for Alpha:
- Point change = 60 × 1.75 × (1.0 − 0.76)
- Point change = 60 × 1.75 × 0.24
- Point change = +25.23 points
Step 5 — Bravo's change: Rankings are zero-sum — the points that one team gains, the other loses. So Bravo loses 25.23 points.
Final ratings: Alpha goes from 1,500 to 1,525.23. Bravo goes from 1,300 to 1,274.77.
Notice that Alpha only gained 25 points despite winning by 3 runs in a major championship. That's because Alpha was already expected to win. If Bravo had pulled the upset and won 6–3 instead, Bravo would have gained about 79.80 points — a much larger swing, because the underdog defied expectations.
Upset Example
Same teams, same championship, but this time Bravo wins 6–3 (the upset):
- Bravo's actual result = 1.0, expected result = 0.24
- Point change = 60 × 1.75 × (1.0 − 0.24) = 60 × 1.75 × 0.76 = +79.80
- Alpha loses 79.80 points
This is what makes Elo rankings fair: upsets are rewarded proportionally. The bigger the gap between the teams, the more the underdog gains (and the more the favorite loses) when the expected outcome doesn't happen.
Placement Bonuses
In addition to game-by-game point changes, teams can earn bonus points for their final finishing position in a tournament. Administrators configure how many bonus points each position gets (e.g., 1st place = +200, 2nd = +100, 3rd = +50). These bonuses are added on top of the game-by-game points when tournament placements are recorded.
For bracket tournaments (single or double elimination), placements are generated automatically when the final match is completed. For other formats, administrators enter placements manually.
Starting Points and Auto-Enrollment
Teams do not need to be manually enrolled in the ranking system. The first time a team plays a ranked game, the system automatically gives them starting points (configured per tournament category, typically 1,500). From that point on, every finalized game adjusts their rating.
Table Columns
- # — Rank position (top 3 shown with medal badges)
- Team — Club name with country flag (click to view ranking history)
- Points — Current Elo rating points
- Chg — Point change since last update (green = gained, red = lost, NEW = first ranking)
- Games — Number of ranked games played
Click any column header (Team, Points, Chg, Games) to sort the table by that column. Click again to reverse the sort direction.
Club Ranking Detail
Click any club name on the rankings leaderboard to view its full ranking history. The detail page shows three charts: a Rating Over Time line chart that plots the team's Elo points over time with color-coded data points for each type of change (gold for games, green for placements, gray for starting points, red for adjustments), a Point Changes by Type bar chart that shows total gains (green) and losses (red) grouped by entry type, and a Win/Loss Point Distribution histogram showing how game point changes are distributed across ranges (green for gains, red for losses). Hover over any point or bar to see details.
Below the chart, the history table shows the date, type of change (Game, Placement, Start, or Adjustment), context (opponent for games, tournament for placements), points before, point change, and points after. Game entries link to the game detail page. Use the scope tabs to switch between Europe and World history. Click Back to Rankings to return to the leaderboard.
16. PLAYER DIRECTORY
The Player Directory is a searchable public list of all players in the system. Use it to find player profiles, view statistics, and see game history.
Filtering and Searching
The Players page includes a collapsible filter panel. Click Show Filters to expand it. You can filter by:
- Search — Enter text to search by first name, last name, nickname, or player ID.
- Position — Select a position from the dropdown to show only players at that position.
- Country — Select a country to show only players of that nationality.
Click Apply Filters to filter the list, or Clear All to reset all filters. When filters are active and the panel is collapsed, a badge shows how many filters are applied.
Sorting and Navigation
Click any column header (Player, Position, B/T, Country) to sort the table. Click again to reverse the sort order. Country flags are shown next to each player's nationality. Results are paginated with a configurable page size (25, 50, or 100 per page) and full navigation controls (First, Previous, Next, Last).
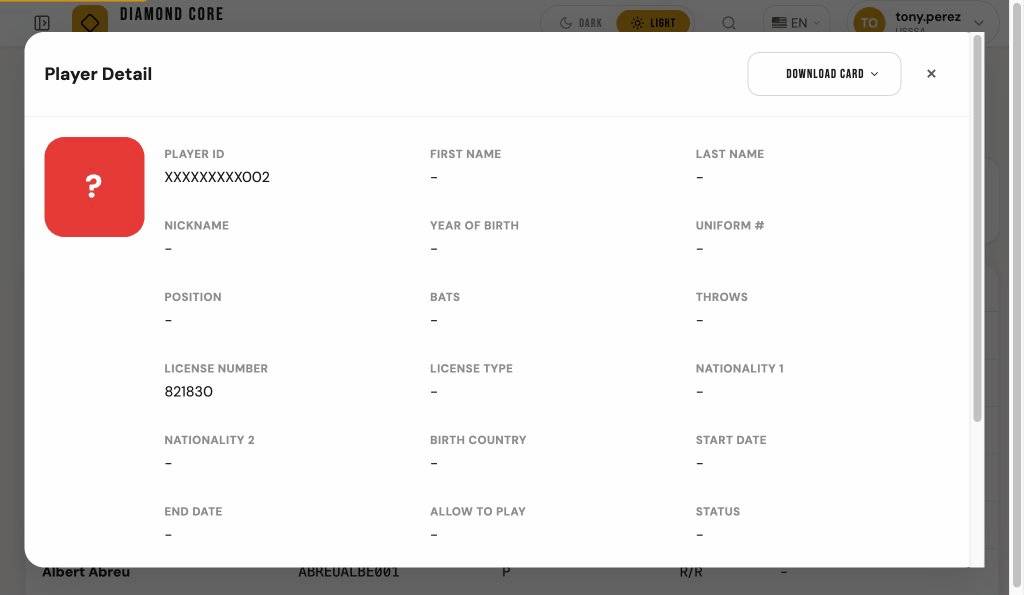
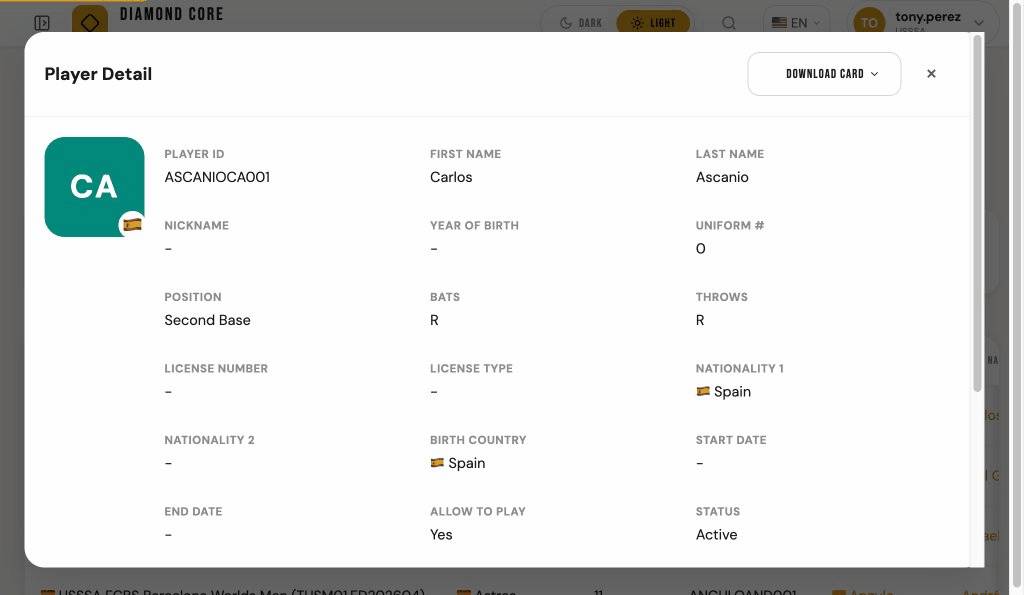
Player Detail
Click any row in the table to open a Player Detail modal. The modal has four tabs:
- Tournament Stats — Per-tournament batting stats (PA, R, H, 2B, 3B, 4B, HR, IHR, RBI, BB, IBB, K, SF) and pitching stats (G, IP, BF, H, R, BB, IBB, K, HR, RA, WHIP) if the player has pitched. Columns are sortable by clicking the header.
- Game Log — Per-game batting and pitching stats. Click any row to navigate to that game's detail page. Pitching columns appear only if the player has pitched in at least one game.
- Biography — Player biography, notes, and external links (if available).
- Sanctions — Sanction status with start date, end date, and reason. Shows "No sanctions on record" if the player is not sanctioned.
The modal also shows the player's photo (or colored initials), profile information (name, ID, position, license, nationality, etc.), and status.
Close the modal by clicking the × button, clicking outside the modal, or pressing the Escape key. Your filters and page position are preserved.

Player Profile Page
Each player has a dedicated full-page profile at /players/<player_id>/. The profile page mirrors the player detail modal layout with three tabs:
- Tournament Stats — Per-tournament batting and pitching statistics with sortable columns and pagination.
- Game Log — Per-game stats with clickable rows that navigate to the game detail page.
- Biography — Biography text, notes, and external links.
The profile page includes OpenGraph meta tags for social sharing (links shared on social media will display the player name and description). The player info card shows the avatar with nationality flag badge and key fields (ID, name, position, bats/throws, license, nationality, birth country).
Note: The profile page does not show the Sanctions tab, as sanction information is only visible in the player detail modal accessible from roster management views.
Player Cards (Admin)
Administrators can generate printable player ID cards in CR-80 credit card format (85.6 x 53.98 mm). Each card has a front (player photo, name, nationality, team, sport, ID) and back (QR code linking to the player profile page).
- Single Player Card — On the player profile page, click the "Download Card" dropdown, select a team context, and choose PDF or PNG format.
- Batch Roster Cards — On the Setup > Roster list page, click "Download All Cards" and choose: PDF Duplex (front + back per player), PDF Fronts Only, or PDF Backs Only.
- Per-Player Card — In the roster list, each player row has a card icon in the Actions column for downloading that player's card individually.
Cards are designed for use with ID card printers. The QR code on the back links to the player's public profile page.
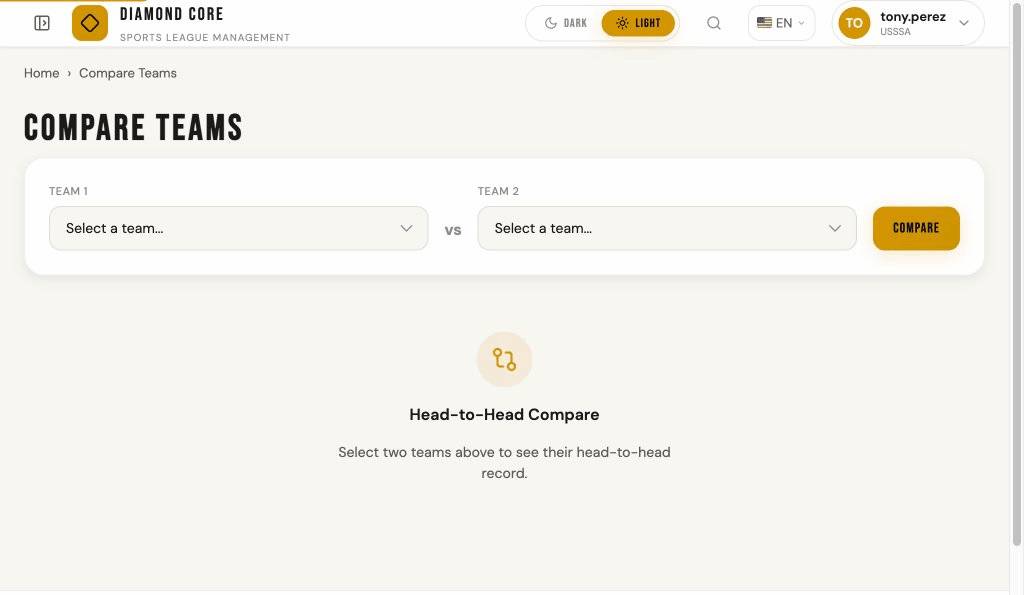
15. COMPARE TEAMS
The Compare Teams page lets you view head-to-head statistics between any two teams in your system. This is useful for analyzing matchups, understanding historical performance between rivals, and comparing team statistics side by side.
Accessing Compare Teams
Click Compare in the sidebar under the RESULTS section, or use the Compare Teams button on the Standings or Rankings pages.
Selecting Teams
On the Compare Teams page, use the two dropdown selectors to choose:
- Team 1 — The first team to compare
- Team 2 — The second team to compare
Both dropdowns list all teams in your system. Once you select two different teams, click the Compare button to view the comparison results. The URL will update to include the team IDs (e.g., /compare/?team1=5&team2=12) so you can bookmark or share the comparison.
Head-to-Head Record
The first section displays the teams' record against each other in a simple format:
- Wins — How many games each team has won against the other
- Draws — How many games ended in a tie
If the teams have never played each other, a message will appear stating this.
Batting Comparison
The Batting Comparison table shows aggregated batting statistics for each team across all games. This includes:
- G — Number of games
- PA — Total plate appearances
- H — Total hits
- HR — Home runs
- RBI — Runs batted in
- R — Runs scored
- BB — Walks
- K — Strikeouts
- AVG — Batting average (hits / at-bats)
- OBP — On-base percentage
- SLG — Slugging percentage
- OPS — On-base plus slugging
Pitching Comparison
The Pitching Comparison table shows aggregated pitching statistics for each team across all games. This includes:
- G — Number of games
- IP — Innings pitched
- H — Hits allowed
- R — Runs allowed
- BB — Walks issued
- K — Strikeouts
- HR — Home runs allowed
- RA — Run average (runs allowed per 9 innings)
- WHIP — Walks plus hits per inning pitched
- K/9 — Strikeouts per 9 innings
- BB/9 — Walks per 9 innings
In both comparison tables, the leading value in each statistic is highlighted in gold to make it easy to see which team has the edge.
Comparison Charts
Below the stat tables, interactive Comparison Charts provide visual summaries of the data. All charts adapt to dark and light mode automatically. Each chart has a help (?) button explaining what it shows. The six charts are:
- Team Profile Overlay — Radar chart comparing both teams across 6 key metrics (AVG, OBP, SLG, OPS, K/9, WHIP). Values are normalized so the team with the higher value fills the axis.
- Head-to-Head Stat Duel — Back-to-back horizontal bars showing counting stats (PA, H, HR, RBI, R, BB, K) for both teams side by side.
- Plate Outcome Breakdown — 100%% stacked bars showing the percentage of plate appearances resulting in hits, walks, strikeouts, or other outs for each team.
- Stat Advantage — Lollipop chart showing which team has the advantage in each rate stat. Bars extend right (gold) when Team 1 is better, left (blue) when Team 2 is better.
- Offensive vs Pitching Profile — Concentric donut charts showing batting outcomes (left) and pitching outcomes (right). Outer ring is Team 1, inner ring is Team 2.
- Pitching Matchup — Grouped horizontal bars comparing all pitching stats side by side. Arrow indicators show whether higher or lower is better for each stat.
Games Between Teams
The Games Between Teams table lists all games played between the two selected teams, ordered by most recent first. For each game, you can see:
- Date — When the game was played
- Tournament — Which tournament edition the game was part of
- Home / Away — The home and away teams with country flags (the winning team and score are shown in bold)
- Score — The final score
- Status — The game status (e.g. Final, Live, Scheduled)
If the teams have no games in common, this section will not appear.
17. ROSTERS
The Rosters page shows which players are eligible to play in each tournament edition.
Use the filters to pick a tournament edition and club. The table shows each player's name, uniform number, position, batting/throwing preference, and eligibility dates.
Like the Games page, you can sort by clicking column headers (and Shift+click for multiple columns).
Additional Filters
Click Show Filters to expand the filter panel. In addition to Tournament Edition and Club, you can search by First Name, Last Name, Nickname, and Position. Type part of a name or position and click Apply Filters to narrow the results. When filters are active and the panel is collapsed, a badge shows the count. Active filter pills appear below the panel; click Clear All Filters to reset.
Player Detail
Click any row in the roster table to open a detail panel for that player. The panel shows the player's full profile (name, photo, nationality, license) and four tabs: Tournament Stats (batting and pitching), Game Log (per-game stats with clickable rows), Biography (bio text, notes, external links), and Sanctions (sanction status, dates, reason). You can sort tables by clicking column headers and page through the results. Press Esc, click the × button, or click outside the panel to close it.
The player avatar shows the uploaded photo if available. If no photo exists, colored initials are displayed (derived from the player's name). A country flag badge appears on the avatar corner when the player has a nationality set.
18. APPEARANCE
Dark and Light Mode
Diamond Core has two visual themes:
- Dark mode — Dark background with light text. Easier on the eyes in low-light environments (night games, indoor venues).
- Light mode — White background with dark text. Better for bright environments or personal preference.
Switch between them using the Dark / Light toggle in the top-right corner of any page. Your choice is saved and will be remembered next time you visit.
If you have never set a preference, the system uses your device's setting (if your phone or computer is set to dark mode, Diamond Core will start in dark mode too).
Language
Diamond Core is available in multiple languages: English, Spanish, Italian, and German. Use the language selector in the top navigation bar, next to the search icon, to switch languages. The selector displays flag emojis alongside language codes and is available whether you are signed in or not.
Your language preference is saved in a cookie and will be remembered when you return to the site.
19. FAVORITES / MY TEAM
The Favorites feature lets you mark your favorite teams as a quick reference. Use star buttons (★) across the app to save and manage your favorite clubs.
Marking Favorites
Look for the star icon (☆) next to club names on standings, rankings, and other team pages. Click the star to add a club to your favorites. The star will turn gold (★) and fill in, indicating it is now a favorite. Click again to remove it from favorites.
Your Favorites Storage
- For authenticated users: Favorites are saved in your account and persist across devices and sessions.
- For guest users: Favorites are stored locally in your browser (no account needed). They will persist when you return to the site, but will be lost if you clear your browser cookies.
Accessing Your Favorites
Star icons appear on standings, rankings, team comparison pages, and other team listing pages. Click any star icon to toggle a favorite. The display updates instantly without requiring a page reload.
20. KEYBOARD SHORTCUTS
When recording plays on the scoring sheet, you can use keyboard shortcuts instead of clicking buttons. This is much faster during live games.
21. SESSION TIMEOUT
If your organization has configured a session timeout, your session will automatically end after a period of inactivity. This protects your account from unauthorized access on unattended devices.
How It Works
- The system tracks your activity (mouse clicks, keyboard input, scrolling).
- If no activity is detected for the configured timeout period, you will be automatically logged out and redirected to the login page.
- If a warning period is configured, a countdown dialog will appear before the timeout expires. Click Stay Logged In to reset the timer and continue working.
Multiple Tabs
Activity in any open tab counts as activity for all tabs. If you are active in one tab, the timeout will not trigger in another tab.
22. NOTIFICATIONS
Diamond Core keeps you informed about important game events through an in-app notification system. The notification bell in the top bar shows you recent game updates.
The Notification Bell
The notification bell icon is located in the top bar (next to the search icon). A badge number on the bell shows how many unread notifications you have. Click the bell to open the notification panel and view recent updates.
Notification Types
You may receive notifications for these game events:
- Game Started — When a scheduled game transitions to live scoring.
- Final Score — When a live game is finalized with a score.
- Score Update — When the score changes during a live game.
Reading Notifications
Click the notification bell to open the panel. Each notification shows:
- The event message (e.g., "Team A vs Team B has started!").
- The date and time the notification was created.
Dismissing Notifications
Click any notification to mark it as read and navigate to the game detail page. Read notifications appear dimmed in the panel.
To dismiss all notifications at once, click the Mark all read link at the top of the notification panel. This clears the badge count and dims all notifications.
Automatic Updates
The notification badge updates automatically every 60 seconds. You do not need to refresh the page to see new notifications.
Notification History
Notifications are stored for up to 7 days. Older notifications are automatically removed from the system.
23. SHARING LINKS
Diamond Core makes it easy to share game information, box scores, and standings with other people. You can copy the page link or use your device's native sharing options.
Share Buttons
Pages for game details, box scores, and standings display two buttons:
- Copy Link — Copies the page URL to your clipboard. A confirmation message shows briefly after copying.
- Share — Opens your device's native share menu (if available) to share with messaging apps, email, or social media. On devices without native sharing support, this button falls back to copying the link.
Shared Content Information
When you share a game or box score link, the following information is included in the share preview:
- Team names and matchup details (for example, "Team A vs Team B")
- Final or current score (when available)
- Automatic rich previews on social media and messaging apps
24. PRIVACY & COOKIES
Privacy Policy
Diamond Core is committed to protecting your personal data. Our Privacy Policy explains what data we collect, why we collect it, and how it is used. You can read the full policy at any time by clicking Privacy in the footer of any page.
Cookie Policy
Our Cookie Policy describes the cookies used on the platform. You can read it by clicking Cookies in the footer.
Cookies We Use
- Essential cookies — Required for the site to function (session, security token, consent record). These cannot be disabled.
- Functional cookies — Used for language preferences and favorites. You can accept or decline these when the cookie banner appears.
Cookie Consent Banner
When you first visit Diamond Core, a banner appears at the bottom of the screen asking for your cookie preferences. You can choose Accept All to enable all cookies, or Essential Only to use only the cookies required for the site to work. Your choice is remembered and the banner will not appear again.
25. BROADCASTING
Diamond Core provides live broadcast overlays that can be embedded in streaming software like OBS Studio. These overlays update automatically as games are scored.
Scorebug Overlay
The scorebug is a broadcast-quality overlay inspired by Sportsnet. It shows the current pitcher with batters faced, the current batter with running batting average (recalculated including the current game), both team names with country flags and scores, a game timer (color-coded by remaining time), and the inning number with outs. The home team row is displayed in gold and the away team text is white for contrast. Outs are shown as red dots. Country flags are displayed next to each team name. If no lineup data is available, the pitcher and batter rows are hidden.
- URL —
/embed/scorebug/<game_id>/ - Clean mode — Add
?clean=1for a transparent background (ideal for OBS chroma key). - Theme — Add
?theme=lightor?theme=dark(default is dark). - Poll interval — Add
?interval=3000to change the refresh rate in milliseconds (default 5000). - Hide timer — Add
?timer=0to hide the game timer column. This is useful when the timer is incorrect or there are delays that could cause confusion for teams.
Line Score Overlay
The line score overlay displays the inning-by-inning score table with R/H/E totals. It expands automatically for extra innings and shows "X" for unplayed home innings (walk-off games).
- URL —
/embed/linescore/<game_id>/ - Same query parameters —
?clean=1,?theme=, and?interval=work the same as the scorebug.
Batter Info Overlay
The batter info overlay shows the current batting lineup for the team at bat, including uniform numbers and field positions, plus the opposing pitcher. It updates automatically as the game progresses.
- URL —
/embed/batter/<game_id>/ - Same query parameters —
?clean=1,?theme=, and?interval=work the same as the scorebug.
Scoring Box Overlay
The scoring box overlay displays full batting and pitching statistics for both teams in a box score format. Shows AB, R, H, RBI, BB, K for batters and IP, H, R, BB, K for pitchers.
- URL —
/embed/scorebox/<game_id>/ - Same query parameters —
?clean=1,?theme=, and?interval=work the same as the scorebug.
Big Play Overlay
The big play overlay monitors the game for significant scoring plays and displays a popup notification that automatically fades after 5 seconds. Ideal for adding excitement to your stream.
- URL —
/embed/bigplay/<game_id>/ - Same query parameters —
?clean=1,?theme=, and?interval=work the same as the scorebug.
Using with OBS Studio
To add an overlay to your stream, add a Browser Source in OBS and paste the embed URL. Use ?clean=1 for a transparent background so the overlay appears on top of your game video. Set the width and height in OBS to match your desired overlay size.
Administrators can find all embed URLs and API endpoints for a specific game on the Game Detail page, in the "Broadcast Overlays" section. Each URL has a Copy button for easy pasting into OBS.
Ticker Overlay
The ticker overlay displays scrolling announcements at the bottom of the screen. Messages are created in Setup and can be scoped to all games, a specific edition, or a specific game. Each message has a severity level (info, warning, urgent) and a time window.
- URL —
/embed/ticker/ - Edition scope — Add
?edition=<id>to show only messages for a specific edition. - Game scope — Add
?game=<id>to show only messages for a specific game. - Same query parameters —
?clean=1,?theme=, and?interval=work the same as the scorebug.
Broadcast Config (Admin)
Administrators can enable or disable broadcasts per tournament edition via Setup > Broadcast Config. When broadcasts are disabled for an edition, all overlay endpoints and API calls for games in that edition return a 403 error. An optional delay (in seconds) can be configured to serve data on a time delay.
- Setup URL —
/setup/broadcast/config/ - Setup home — A "Broadcast Config" card on the Setup home page links directly to this page.
- Default behavior — If no config exists for an edition, broadcasts are enabled by default.
- Show Timer — Controls whether the timer column is visible in the scorebug overlay. Changes take effect within seconds (on the next poll cycle). The
?timer=0and?timer=1URL parameters still override this setting.
Ticker Messages (Admin)
Administrators can create ticker messages via Setup > Ticker Messages. Each message has a severity (info, warning, urgent), a time window (active from/to), and a scope (all, edition, or game). Messages are automatically shown on ticker overlays during their active window and hidden when expired.
- Setup URL —
/setup/broadcast/ticker/ - Setup home — A "Ticker Messages" card on the Setup home page links directly to this page.
Real-Time Updates
When Supabase Realtime is enabled, overlay embeds automatically subscribe to live game channels and update within one second of a scoring change — no manual refresh needed. Polling continues as a fallback if the realtime connection drops.
An SSE (Server-Sent Events) endpoint is also available as an alternative real-time channel for clients that cannot use Supabase Realtime. Connect to /api/v1/broadcast/game/<id>/sse/ to receive game_update events whenever the game state changes.
Broadcast API
JSON endpoints are available for custom integrations. These are public and require no authentication:
/api/v1/broadcast/game/<id>/state/— Full game state/api/v1/broadcast/game/<id>/scorebug/— Scorebug data/api/v1/broadcast/game/<id>/linescore/— Line score data/api/v1/broadcast/game/<id>/batter/— Batter info data/api/v1/broadcast/game/<id>/scorebox/— Scoring box data/api/v1/broadcast/games/live/— All live games/api/v1/broadcast/game/<id>/sse/— Server-Sent Events stream (real-time fallback)/api/v1/broadcast/ticker/— Active ticker messages (scope with ?edition= or ?game=)
Cache-Control and ETag headers. Send If-None-Match with the ETag value to receive a 304 response when data hasn't changed.
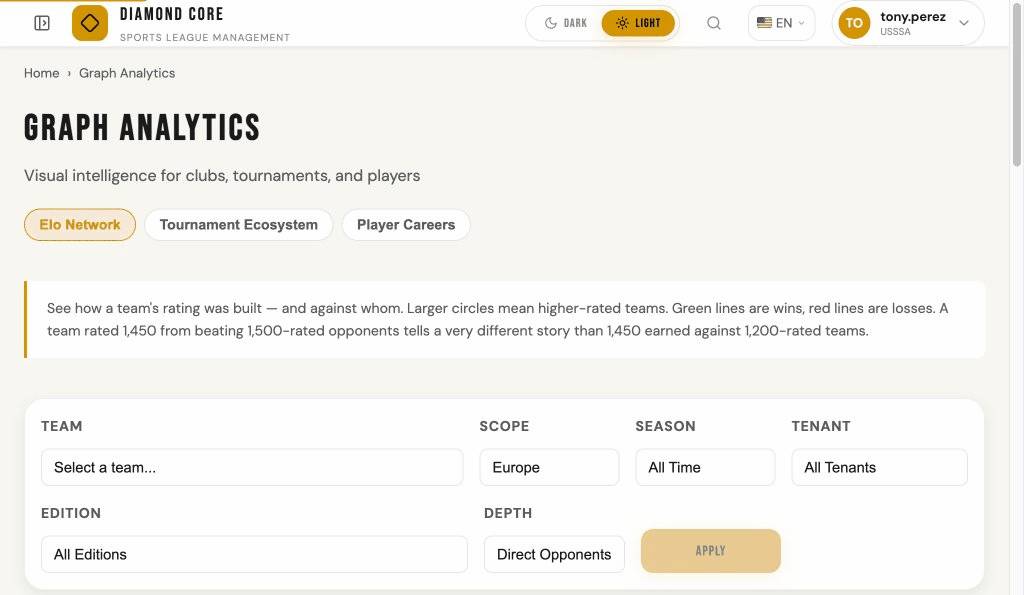
26. GRAPH ANALYTICS
Graph Analytics is found in the Intelligence section of the sidebar. It provides three interactive network visualizations that reveal relationships between clubs, tournaments, and players. Each tab features a force-directed graph on the left and contextual sidebar cards on the right.
All three graphs support zoom (scroll wheel), pan (click-and-drag on background), and node dragging. Hover any node or edge for a tooltip with key statistics. Click a node to update the sidebar cards with detailed information. Toggle between dark and light mode — graphs re-render automatically.
Tab 1: Elo Rating Network
The Elo Network answers the question: "Who has this club played, and how did those games affect their rating?" Select a team from the dropdown, choose the ranking scope (Europe or World), optionally filter by season, and click Apply.
Nodes represent clubs. Each node's size reflects the club's current Elo rating — larger nodes have higher ratings. The focus club appears in gold with a white border and glow. Direct opponents are blue. When depth is set to "2nd Degree", opponents-of-opponents appear in muted grey.
Edges (lines between nodes) represent game history between two clubs. Green edges mean the focus club has a winning record against that opponent. Red means a losing record. Grey means an even or mixed record. Thicker edges indicate more meetings between the two clubs.
Sidebar cards: The Selected Team card updates when you click any node and shows the club's rating, games played, win rate, average opponent rating, and — for opponents — the head-to-head record (wins, losses, draws) plus the last 3 game results with Elo point changes. The Legend card explains the color coding. The Recent Changes card shows the focus club's last 5 Elo point changes with opponent name, delta, and running total.
Filters: Scope toggles between Europe and World rankings. Season limits data to a specific ranking season's date range. Tenant restricts data to a specific league or organization. Edition narrows data to a specific tournament edition. Depth controls whether only direct opponents (1st degree) or also their opponents (2nd degree) appear. On any club's Ranking History page, click View Elo Network to jump here with that club pre-selected.
Tab 2: Tournament Ecosystem
The Tournament Ecosystem answers the question: "How are tournaments connected through the teams that participate in them?" Click Apply to generate the graph. Each node is a tournament edition; each edge means two tournaments share one or more clubs.
Nodes represent tournament editions. Each node's size reflects how many teams participated — larger nodes had more teams. Node color indicates the tournament's ranking weight: gold for high-weight tournaments (e.g., SuperCup, weight ≥ 40), blue for medium-weight (e.g., EuroCup, weight 20–39), and grey for lower-weight tournaments (weight < 20).
Edges connect tournament editions that share clubs. Thicker, brighter (gold) edges indicate many shared teams, while thin grey edges indicate few. The edge tooltip shows the exact number of shared teams.
Sidebar cards: The Selected Tournament card updates when you click a node and shows the tournament name, edition, team count, game count, ranking category, game weight, date range, and its top 5 connections to other tournaments with shared team counts. The Legend card explains node colors (weight tiers) and edge thickness (shared teams). The Strongest Connections card shows the top 5 tournament pairs across the entire graph with the most shared teams.
Filters: Scope filters by All, Europe, or World (based on ranking category assignment). Season limits to editions overlapping a ranking season. Tenant restricts editions to a specific league or organization. Edition focuses on a single tournament edition. Min Shared Teams sets the threshold — only edges with at least this many shared teams appear. Raising this value simplifies the graph by hiding weaker connections.
Tab 3: Player Career Paths
The Player Careers tab answers the question: "Where has this player been, and how does their career path compare to another player's?" Select a player from the dropdown and click Apply. Optionally select a second player in the "Compare with" dropdown to overlay both career paths.
Nodes come in two types. Player nodes are circles — the focus player appears in gold, the comparison player (if any) in purple. Club nodes are rounded rectangles in blue. Each club the player has been rostered at appears once; edges from the player to each club represent roster memberships.
Edges connect players to clubs. Each edge represents a roster membership in a specific tournament edition. Edge labels show the year. The edge tooltip shows the tournament name, edition, playing position, and uniform number. Gold edges belong to the focus player; purple edges belong to the comparison player. When two players share a club, both paths converge on the same club node.
Sidebar cards: The Selected Player card shows the player's name, ID, position, batting side, and throwing hand — updating when you click a player or club node. The Legend card explains node shapes and colors. The Club History card lists every club the player has been rostered at, organized chronologically with tournament and edition details. In compare mode, both players' histories appear in the same card, color-coded gold and purple.
Filters: Tenant restricts roster data to a specific league or organization. Edition narrows the career path to a specific tournament edition. The player search also respects these filters, showing only players with rosters matching the selected tenant or edition.